Incredibly, President Trump’s stealth triumph on immigration has continued—the February job report, released early March [PDF], shows, once again, that the immigrant workforce population is falling, year over-year. However, a sizable rise in displacement of American workers by immigrants is evident for the month. And wage growth is still slow.
Additionally, of course, the February data were collected before the Coronavirus panic. “There is a red line in the calendar,” said Ian Shepherdson, chief economist at Pantheon Macroeconomics. “The value of it is that this report gives us kind of a benchmark of where we were before things began to go wrong.” [U.S. Added 273,000 Jobs in February Before Coronavirus Spread Widely, by Patricia Cohen, New York Times, March 6, 2020].
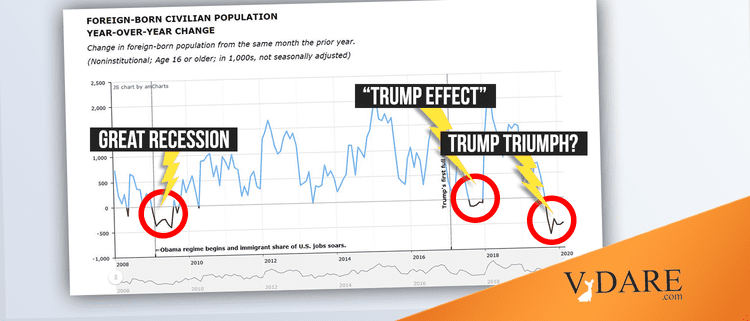
The Coronavirus panic will certainly hit the economy. But its impact on the immigrant population and American worker displacement are less clear. It may be that immigrants will get squeezed out in a downturn, as they were in the 2008-2009 Great Recession
February marked the sixth straight month of absolute decline in the foreign-born working-age population (16 years+). It dropped by 499,000, a 1.15% decline compared to the same month last year. (In both January and December foreign-born employment dropped by 547,000, year-over-year.)
This six-month decline follows a protracted slowing in the immigrant workforce growth rate that can be traced back to early 2018.
This current immigrant workforce decline now actually exceeds that seen in the 2008 Great Recession. Back then immigrants were leaving at the rate of 300,000 to 400,000 a month, year-over-year. Since September, they have bailed at 400,000 to 725,000 a month.
And back in 2008-9, the outflux was driven by economic malaise. Now the economy is strong (or was, pre-Corona).
Meanwhile, the BLS Payroll Survey found a booming labor market in February: 273,000 jobs added, blowing past the 165,000 estimate of so-called experts. The unemployment rate declined to 3.5% from January’s 3.6%.
Revisions to data from prior months added another 85,000 to payroll employment growth of the prior three months.
However, our analysis of the Household Survey of Employment, on which our monthly displacement analysis rests, shows a modest 45,000 overall job gain for the month of February, with native-born Americans losers while immigrants were big gainers.
In February:
- Immigrants gained 465,000 jobs, an increase of 1.7%
- Native-born Americans lost 420,000 jobs, a 0.3% decline.
- com’s immigrant employment index, set at 100.0 in January 2009, rose to 128.6 from January’s 126.4, a 1.7% gain.
- The Native-born American employment index fell to 108.6 from January’s 108.9, a 0.3% loss.
- The New VDARE American Worker Displacement Index (NVDAWDI), our name for the ratio of immigrant to Native-born American employment growth indexes since Jan. 2009, rose to 118.4 from January’s 116.0, a rise of 2.1%. It had been moving sideways in a narrow range since mid-2019.
While February was a bad month for native-born workers relative to their immigrant competitors, the past 12 months was great for them: Natives gained 1.969 million jobs, while immigrants lost 120,000.
The chart shows Native-born American workers lost ground to their foreign-born competitors throughout the Obama years. This accelerated significantly in the months leading up to the 2016 election. Trump has not yet reversed the Obama damage, but he did seem to have gotten the displacement deterioration in his own first years under control.
It’s odd on its face that immigrants would be displacing more American workers while their own presence in the workforce is falling. It may be just statistical noise to be washed out in future months, or possibly the unusually mild winter is benefitting industries that employ disproportionate numbers of immigrants, like construction.
From January 2017 through February 2020 Trump presided over a labor market in which immigrants gained 1.841 million jobs, a 7.1% increase, while native-born Americans gained 4.837 million, a rise of 3.8%. In percentage terms, the immigrant/native-born job creation gap under Trump — currently 3.3 percentage points in favor of immigrants—is comparatively low. As recently as April it was 7.1 percentage points, with immigrant employment rising 8.9% since the start of his administration, while native-born American employment rose 1.8%.
Another way of looking at American worker displacement: the immigrant share of total U.S. employment. A smaller immigrant share denotes less displacement of native-born American workers:
Since peaking at 17.8% in February 2019, the immigrant share of total employment has drifted downward. This February immigrants held 17.5% of all jobs. May through July 2020 were particularly good—native-born Americans gained jobs each month, while immigrants lost them.
More good news: data in the February report show that on two important metrics—working-age population and employment—native-born American workers outpaced immigrants by comfortable margins over the past 12 months.
|
Employment Status by Nativity, Feb.2019-Feb.2020
|
|
(numbers in 1000s; not seasonally adjusted)
|
|
|
Feb-19
|
Feb-20
|
Change
|
% Change
|
|
|
Foreign born, 16 years and older
|
|
Civilian population
|
43,455
|
42,956
|
-499
|
-1.15%
|
|
Civilian labor force
|
28,892
|
28,719
|
-173
|
-0.60%
|
|
Participation rate (%)
|
66.5
|
66.9
|
0.4pts.
|
0.60%
|
|
Employed
|
27,817
|
27,697
|
-120
|
-0.43%
|
|
Employment/population (%)
|
64
|
64.5
|
0.5pts.
|
0.78%
|
|
Unemployed
|
1,075
|
1,022
|
-53
|
-4.93%
|
|
Unemployment rate (%)
|
3.7
|
3.6
|
-0.1pts.
|
-2.70%
|
|
Not in labor force
|
14,563
|
14,237
|
-326
|
-2.24%
|
|
|
Native born, 16 years and older
|
|
Civilian population
|
214,937
|
216,673
|
1,736
|
0.81%
|
|
Civilian labor force
|
133,901
|
135,516
|
1,615
|
1.21%
|
|
Participation rate (%)
|
62.3
|
62.5
|
0.2pts.
|
0.32%
|
|
Employed
|
128,351
|
130,320
|
1,969
|
1.53%
|
|
Employment/population (%)
|
59.7
|
60.1
|
0.4pts.
|
0.67%
|
|
Unemployed
|
5,550
|
5,196
|
-354
|
-6.38%
|
|
Unemployment rate (%)
|
4.1
|
3.8
|
-0.3pts.
|
-7.32%
|
|
Not in labor force
|
81,036
|
81,157
|
121
|
0.15%
|
|
Source: BLS, The Employment Situation, February,2020. Table A-7, March 6, 2020.
|
|
http://www.bls.gov/news.release/pdf/empsit.pdf
|
From February 2019 to February 2020:
- The native-born American working-age population grew by 1.736 million, a gain of 0.81%; the corresponding immigrant population fell by 499,000—a 1.15% loss. For the sixth consecutive month, the number of working-age immigrants declined, year-over-year.
- Native-born American employment rose by nearly 2 million, up 1.5%; foreign-born employment fell 120,000, off by 0.43%. Another comeback month for American workers; as recently as last June immigrants gained jobs nearly three times as fast, year-over-year.
- The immigrant labor force (working or looking for work) fell by 173,000, a 0.6% decline; the native-born labor force jumped by 1.62 million, a 1.21% gain. Advantage native-born Americans.
- Unemployment rates fell for both immigrants and native-born, but the native-born rate fell by 7.32% (from 4.1% to 3.8%) while immigrant unemployment dropped by only 2.70% (from 3.7% to 3.6.) Advantage native-born — especially noteworthy at a period when the native labor force is growing rapidly and the immigrant labor force is in decline.
- Labor-force participation rates rose for both immigrants and native-born, with the immigrant rate rising by nearly twice as much in percentage terms—0.60% versus 0.32%. Another month of increased confidence (vis-â-vis the same month last year) on the part of all workers.
Immigrant Labor force Participation Rate in February 2020 (66.9%) is well above that of native-born (62.5%), reflecting the larger fraction of retirees in the native-born labor force.
The data also show that 5.20 million native-born and 1.02 million immigrants were unemployed in February 2020, but over the last year the number of unemployed persons fell for both groups. In percentage terms, the number of native-born unemployed dropped by 6.38%, slightly more than the 4.93% drop for immigrants.
How is this happening when Trump has not passed any legislation reducing immigration and when a recent record illegal surge (which reversed the panicky post-election “Trump Effect” outflow) is only just receding?
Apparently through relentless administrative action—for example Trump’s Muslim ban (upheld by the Supreme Court) and ever more thorough adjudication by USCIS. Since January 1st the travel ban has been expanded to six additional countries, including Africa’s most populous, Nigeria.
Note also that Trump has sharply reduced the “refugee” intake, from Obama’s peak of 85,000 to a proposed 18,000 for fiscal 2020. There have been disapproving discussions of this phenomenon in the Leftist media, where it has been described as the “invisible wall”: Trump Got His Wall, After All, by Rachel Morris, Huffington Post, Nov. 24, 2019.
But the wealth test—AKA the public charge rule—may be far more consequential. Before February 24, 2020 legal immigrants were banned from applying for a Green Card only if they failed to demonstrate income above 125% of the poverty line. Now immigration officials can weigh dozens of factors, including age, health, English language skills, credit score, and health insurance coverage [Immigration By Legal Path Begins to Fall, by Zolan Kanno-Youngs, New York Times, February 25, 2020].
According to an analysis by the Migration Policy Institute, the changes could cut legal immigration by up to 65%, and increase the emigration rate of immigrants already here [Millions Will Feel Chilling Effects of U.S. Public-Charge Rule That Is Also Likely to Reshape Legal Immigration, by Jeanne Batalova, Michael Fix, and Mark Greenberg, August 2019].
In the bad old days “public charge” was defined narrowly, counting only cash benefits. This conveniently left out big ticket transfer payments like Medicaid, housing subsidies and food stamps. (VDARE.com pointed out that the “public charge” rule had been sabotaged by bureaucrats back in 2001.)
All but the highest-earning immigrants would be kept out—good news for struggling native-born Americans.
They need it. The discouraging news in the February report: anemic wage growth. Despite a hot job market, wage growth continues to be slow. The increase over the last year was 3.0%—not adjusted for inflation. This compares with a peak pace of 3.5% hit last February.
Trump’s “Invisible Wall” must be helping reduce the supply of labor, and hence increase its price. But it’s still no substitute for cutting back legal immigration—above all, an immigration moratorium.
In other news, apprehensions at the southern border—a proxy for illegal border crossings—appear to be bottoming out, far below the mid-2019 peak, but still above the early 2017 lows, when the late lamented “Trump Effect” was in full force
Edwin S. Rubenstein (email him) is President of ESR Research Economic Consultants