June brings some good news: the shocking surge in immigrant displacement of American workers and in the immigrant workforce, which began in January and completely undid the improvement we had begun hopefully to call the “Trump Effect,” continues to ebb. And apprehensions on the southwestern border continue to fall, suggesting that illegal immigration is receding from the peaks reached this spring. But the damage of the Obama years has still not begun to be undone.
For the second consecutive month, all job growth went to native-born American workers. But their June job gain—114,000—was a fraction of the 1.4 million gain recorded in May. However, for the first time this year the immigrant working age population rose by less than 1 million year-over-year. Still, the June increase —962,000—was higher than that of any June since 2015. In contrast, remember that the immigrant workforce actually shrank in the last five months of 2017.
Of course, both displacement and immigrant workforce growth are still high in absolute terms and could surge again anytime. Only legislation, above all an immigration moratorium, can secure the fruits of the current economic expansion for Americans.
In June:
- Immigrant employment fell by 13,000, down by 0.05%.
- Native-born American employment rose by 114,000—up 0.09%
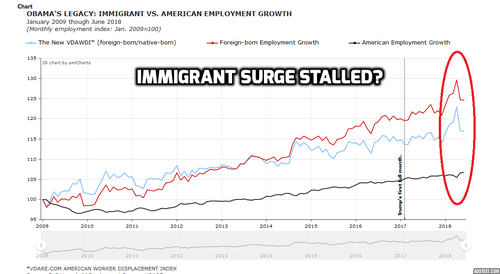
- The immigrant employment index, set to 100.0 in January 2009, fell to 124.6 from 124.7 in May.
- The native-born American employment index rose to 106.7 from 106.6 in May.
- The New VDARE American Worker Displacement Index (NVDAWDI), our term for the ratio of immigrant to native-born employment growth indexes, fell to 116.9 from 117.0 in May. The all-time displacement high, 123.0, was set in April.
Source: BLS Household
Thus Trump has not even begun to repair the damage done by eight years of Obama. Native-born American workers lost ground to their foreign-born competitors throughout the Obama years. And, shown above, this trend accelerated significantly in the months leading up to the 2016 election.
While May and June have been good for native-born American workers, Trump supporters have reason to be restless: Since taking office in January 2017 President Trump has presided over a labor market in which immigrants have gained 993,000 jobs, a 3.8% increase, while native-born Americans gained about 2.5 million jobs—a rise of 2%. As far as the labor market is concerned, “America First” has not fully translated into Americans First.
The Main Stream Media is too steeped in economic euphoria to notice—they almost never report the immigration dimension. But it is now absolutely clear that immigration, and immigrant displacement of American workers, cannot be jawboned away. The only answer is legislation—a border wall to stop the illegal alien flow; a second Operation Wetback, including E-Verify, to get the illegal alien self-deporting; a moratorium on legal immigration.
June 2018 also brought (relatively) good news on the population front. For the first time this year the monthly rise in foreign-born working age population (including illegals) was below 1 million. In June 2018 there were 962,000 more working-age immigrants than in June 2017. This comes on the heels of gains of 1.342 million and 1.597 million, year-over-year, in May and April, respectively.
In percentage terms, however, native-born Americans are still losing ground. The native-born working-age population rose 0.81%, year-over-year, in June while the immigrant population rose by 2.32%. But June’s immigrant population growth rate was the smallest for any month this year, possibly signaling a longer-term “Trump effect” trend.
These are net figures. Over a 12-month period an average of perhaps 300,000 immigrants die and an equal number leave the U.S. voluntarily. So the 962,000 million net rise in foreign-born population, June 2017 to June 2018, implies that nearly 1.6 million foreign-born individuals may have actually settled in the country over those 12 months. (This excludes tourists and other short-term entrants.)
Another way of looking at American worker displacement: the immigrant share of total U.S. employment:
Immigrants accounted for 17.34% of total employment in May. Note that, while significantly below the all-time high of 18.1% recorded in April, the May figure is fourth highest among the 114 months for which we have data.
A detailed snapshot of American worker displacement over the past year is available in the Employment Status of the Civilian Population by Nativity table published in the monthly BLS Report.
|
Employment Status by Nativity, June 2017-June 2018
|
|
(numbers in 1000s; not seasonally adjusted)
|
|
|
Jun-17
|
Jun-18
|
Change
|
% Change
|
|
|
Foreign born, 16 years and older
|
|
Civilian population
|
41,552
|
42,514
|
962
|
2.32%
|
|
Civilian labor force
|
27,540
|
28,115
|
575
|
2.09%
|
|
Participation rate (%)
|
66.3
|
66.1
|
-0.2
|
-0.30%
|
|
Employed
|
26,528
|
27,134
|
606
|
2.28%
|
|
Employment/population %
|
63.8
|
63.8
|
0.0
|
0.00%
|
|
Unemployed
|
1,012
|
981
|
-31
|
-3.06%
|
|
Unemployment rate (%)
|
3.7
|
3.5
|
-0.2
|
-5.41%
|
|
Not in labor force
|
14,012
|
14,399
|
387
|
2.76%
|
|
|
Native born, 16 years and older
|
|
Civilian population
|
213,405
|
215,128
|
1,723
|
0.81%
|
|
Civilian labor force
|
133,796
|
135,162
|
1,366
|
1.02%
|
|
Participation rate (%)
|
62.7
|
62.8
|
0.1
|
0.16%
|
|
Employed
|
127,558
|
129,331
|
1,773
|
1.39%
|
|
Employment/population %
|
59.8
|
60.1
|
0.3
|
0.50%
|
|
Unemployed
|
6,238
|
5,831
|
-407
|
-6.52%
|
|
Unemployment rate (%)
|
4.7
|
4.3
|
-0.4
|
-8.51%
|
|
Not in labor force
|
79,609
|
79,966
|
357
|
0.45%
|
|
Source: BLS, The Employment Situation-June 2018, Table A-7, July 6, 2018.
|
|
PDF
|
Over the past 12 months (June 2017 to June 2018):
- The immigrant labor force (employed plus looking for work) rose by 575,000, or 2.09%; the native-born American labor force grew by 1.366 million, up by 1.02%. ADVANTAGE IMMIGRANTS
- Immigrant employment grew 2.28%; native-born American employment by 1.39%; ADVANTAGE IMMIGRANTS, THOUGH MUCH REDUCED FROM THE MULTUPLES WE HAVE SEEN EARLIER THIS YEAR
- The unemployment rate for immigrants fell to 3.5%, a 5.4% drop; native-born unemployment fell to 4.3%, an 8.5% decline. A TIE, WITH THE IMMIGRANT RATE LOWER WHILE NATIVE-RATE FALLING FASTER
- The number of unemployed native-born Americans fell by 407,000—a 6.5% drop; immigrant unemployment fell by 31,000—a 5.4% reduction. ADVANTAGE NATIVE-BORN
- The labor-force participation rate, a sign of worker confidence and mobility, fell 0.2 points for immigrants and rose 0.1 points for native-born Americans. This marks the third straight month in which native-born LPRs have risen, year-over-year, relative to those of immigrants ADVANTAGE AMERICANS
Also, it’s increasingly clear that a renewed illegal alien surge began last fall and is only just abating. Border Patrol apprehensions increased, year-over-year, in both May and June. May’s results—a rise of 31,965, or 160.3%, from May 2017, while the June figures were slightly tamer—up 20,908 or 96.5%—from June 2017.
But June does represent the second month in which apprehensions/ crossings have fallen—possibly a sign that Trump’s trumpeting is beginning to have an effect.
Edwin S. Rubenstein (email him) is President of ESR Research Economic Consultants.