The big news in the October jobs data: The immigrant workforce population in the U.S. continues to fall—continuing the trend last seen in early 2017, when the late lamented “Trump Effect” was literally scaring immigrants away. But, also, immigrant displacement of American workers has begun declining again. Is Trump quietly (!) doing something right?
For the second straight month the foreign-born adult workforce population declined in October, year-over-year, by 725,000 or 1.68%, on the heels of a 427,000, or 0.99%, decline in September.
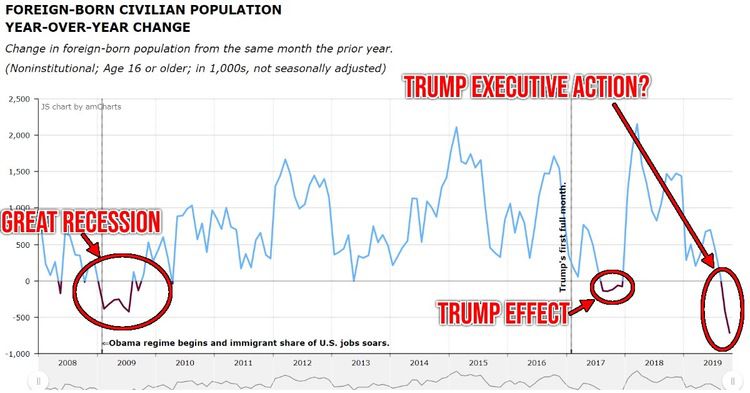
Not since the 2008 Great Recession have immigrant workers bailed in such numbers, year-over-year. Back then the outflux was driven by economic malaise. But now the economy is (relatively) strong. What is driving this exodus?
We continue to be cautious. This decline could be statistical noise. But there’s been a very clear, if erratic, downward trend in year-over-year immigrant worker growth since as far back as March 2018.
It is at least possible that the Trump Administration has actually been able to reduce the inflow through administrative measures: his Muslim ban, (upheld by the Supreme Court), his revised public charge rules, even more thorough adjudication by USCIS. (Vox claims that this more thorough adjudication has resulted in an “almost doubling average wait times for those applying for green cards, employment visas, citizenship, and other benefits”—and that’s before a new rule requiring immigrants to buy health insurance has taken effect: Trump just quietly cut legal immigration by up to 65%, by Nicole Narea, October 9, 2019. Link in original). See also Immigrant Population Growth in the U.S. Slows to a Trickle, by Sabrina Newman, NYT, September 26, 2019 and Report: Trump's Travel Ban Could Soon Get Even Bigger, by Alison Durkee, Vanity Fair, November 1, 2019.
And note that the Trump Administration has sharply reduced the “refugee” intake, from Obama’s peak of 85,000 to a proposed 18,000 for fiscal 2020.
The falling foreign-born workforce may also reflect renewed fear of apprehension and deportation—and, perhaps, an Administration that finally seems to be getting a grip on the influx at the southern border. Mexico, at the not-so-subtle urging of President Trump, has deployed thousands of troops along its border with Guatemala and taken other steps, with significant results.
However, the number of migrants taken into custody by U.S. immigration authorities in fiscal 2019 (the 12 months ending in September) totaled nearly 1 million, marking an 88% percent increase over the previous year, according to Acting Customs and Border Protection Commissioner Mark Morgan.
![]() Morgan, right, criticized Congress for failing to enact legislation to reform the U.S. immigration system:
Morgan, right, criticized Congress for failing to enact legislation to reform the U.S. immigration system:
We still need Congress to pass meaningful legislation to address our broken legal framework when it comes to immigration. And while Congress has failed to bring a single piece of legislation to the floor, this president, this administration is doing exactly what he promised the American people.
Border Apprehensions Dropped to New Low in Last Month of Fiscal Year, NumbersUSA, October 8, 2019
The BLS reported 128,000 new payroll jobs were created in October—a tad below the 130,000 growth for September. This stability came despite a GM strike that idled 50,000 workers, the layoff of 20,000 temporary Census workers, and layoffs at Boeing. Economic growth may be slowing, but the Great American Job Machine is chugging along just fine. The longest economic recovery in U.S. history shows no sign of yielding to recession anytime soon.
Meanwhile, the “other” employment survey, of Households rather than businesses, is even more encouraging. It reported a net 241,000 new jobs created last month, with native-born Americans the gainers, while immigrants were the losers:
In October 2019:
- Immigrants lost 106,000 jobs, a loss of 0.39%
- Native-born Americans gained 347,000 jobs, a gain of 0.26%
- The VDARE.com immigrant employment index, set at 100.0 in January 2009, fell to 125.9 from 126.4 in September
- The Native-born American employment index rose to 108.9 from 108.6 in September
- The New VDARE American Worker Displacement Index (NVDAWDI), our name for the ratio of immigrant to native-born employment growth indexes since Jan. 2009, fell to 115.6 from 116.4.
From VDARE.com’s immigration-focused viewpoint, one that is still almost unreflected in the MSM, this is heartening news. October marks a return to the remarkable three-month stretch, May through July of this year, during which native-born Americans gained jobs while immigrants lost them, a notable reversal of the long-run trend.
Such periods of reverse displacement have been rare. Native-born American workers lost ground to their foreign-born competitors throughout the Obama years. This accelerated significantly in the months leading up to the 2016 election.
Overall, from January 2017 through October 2019, Trump has presided over a labor market in which immigrants gained 1.264 million jobs, a 4.86% increase, while native-born Americans gained 5.165 million, a rise of 4.10%. Note that the immigrant/native-born percentage gap in job creation under Trump—0.76% percentage points in favor of immigrants—is strikingly low. As recently as April of this year it was 7.1%; immigrants gained 2.3 million jobs, an 8.9% rise, while native-born Americans gained 2.264 million, a rise of 1.8%.
Thus, more than three-quarters through his third year in office, Donald Trump is getting close to delivering equal percentage job gains for native-born and immigrant.
Our tag line, “As far as job growth is concerned, ‘America First’ has not translated into Americans First,” is still valid, but only barely. Another month like October and we can celebrate.
Except, of course, that without statutory immigration reduction, it can all be reversed by President Warren.
Another way of looking at American worker displacement: The immigrant share of total U.S. employment. It’s been falling.
Immigrants held 17.19% of jobs in October, down slightly from 17.28% in September, and down more substantially from 17.54% of October 2018. These percentages are based on employment figures that are not seasonally adjusted, so year-over-year comparisons may be more representative of the long-term trend. The record immigrant job share (18.08%) was recorded in April 2018.
We are told there are simply not enough job seekers to fill unfilled job positions. But hourly wage growth has been anemic for much of the recovery, and has stalled again recently. And the wage gap between top and bottom wage earners grows larger. [Jobs Are Plentiful. Big Pay Raises Aren’t, by Neil Irwin, NYT, November 1, 2019] Average earnings growth picked up slightly in October, and was also revised upward for September, but growth has slowed over the past year.
Still, data in the October report show that on three important metrics—working-age population, employment, and labor force participation rate—native-born American workers outpaced immigrants by a considerable multiple over the past 12 months:
|
Employment Status by Nativity, Oct. 2018-Oct. 2019
|
|
(numbers in 1000s; not seasonally adjusted)
|
|
|
Oct-18
|
Oct-19
|
Change
|
% Change
|
|
|
Foreign born, 16 years and older
|
|
Civilian population
|
43,051
|
42,326
|
-725
|
-1.68%
|
|
Civilian labor force
|
28,410
|
28,067
|
-343
|
-1.21%
|
|
Participation rate (%)
|
66.0
|
66.3
|
0.3%pts.
|
0.45%
|
|
Employed
|
27,533
|
27,346
|
-187
|
-0.68%
|
|
Employment/population (%)
|
64.0
|
64.6
|
0.6%pts.
|
0.94%
|
|
Unemployed
|
877
|
722
|
-155
|
-17.67%
|
|
Unemployment rate (%)
|
3.1
|
2.6
|
-0.5%pts.
|
-16.13%
|
|
Not in labor force
|
14,641
|
14,258
|
-383
|
-2.62%
|
|
|
Native born, 16 years and older
|
|
Civilian population
|
215,463
|
217,519
|
2,056
|
0.95%
|
|
Civilian labor force
|
134,313
|
136,509
|
2,196
|
1.63%
|
|
Participation rate (%)
|
62.3
|
62.8
|
0.5%pts.
|
0.80%
|
|
Employed
|
129,419
|
131,721
|
2,302
|
1.78%
|
|
Employment/population (%)
|
60.1
|
60.6
|
0.5%pts.
|
0.83%
|
|
Unemployed
|
4,894
|
4,788
|
-106
|
-2.17%
|
|
Unemployment rate (%)
|
3.6
|
3.5
|
-0.1%pts.
|
-2.78%
|
|
Not in labor force
|
81,150
|
81,010
|
-140
|
-0.17%
|
|
Source: BLS, The Employment Situation October 2019, Table A-7, November 1, 2019. PDF
|
Over the past 12 months (October 2018 through October 2019):
- The native-born America working-age population grew by 2.056 million, a gain of 0.95%; the corresponding immigrant population fell by 725,000—a 1.7% loss. As recently as June, immigrants were pouring in at this rate; now they’re leaving. (Even the Great Recession didn’t see immigrants bailing in these numbers.) The “Trump Effect” is back, and stronger than ever!
- American employment rose a whopping 2.302 million, up by 1.8%; Foreign-born employment fell 187,000, down by 0.7%. Another remarkable comeback month for native-born American workers, especially after a dismal June during which immigrants gained jobs nearly three times as fast, year-over-year.
- The immigrant labor force (working or looking for work) fell by 343,000, a 1.2% decline; the native-born American labor force roared ahead by 2.2 million, a 1.63% gain. Advantage Native-Born Americans.
- The unemployment rate for immigrants fell to 2.6%, a decline of 16.1% from last October, while the native-born American unemployment rate fell to 3.5%, a decline of only 2.8%. Advantage immigrants—though this positive reflects the fall in the immigrant labor force. By contrast, the unemployment rate for native-born Americans fell, despite a large rise in the native-born American labor force.
- The labor-force participation rate for native-born Americans rose by 0.5 % points, versus a 0.3 % point rise for immigrants. Another month of increased confidence (vs. the same month last year) on the part of American workers, now that Trump’s tariffs and crackdowns on unauthorized foreign workers are increasing job opportunities.
The data show 4.8 million native-born and 722,000 immigrants were unemployed in October, but over the last year the number of unemployed immigrants collapsed by 17.7%, versus a comparatively modest 2.2% decline in idle native-born. Two related factors may be at play here:
- unemployed immigrants are going home rather than face deportation, and
- U.S. companies are screening out illegals to avoid sanctions from an increasingly vigilant DHS.
Both welcome changes.
But still many employers, and their lobbyists, insist that immigrants are needed to fill the gap.
Bottom line: This is a formidably strong economy and it has been swamping the effects of immigration. The last few months have been especially good for native-born Americans.
But remember, more than three years after Trump’s great victory, GOP Senators are still on the donor-driven immigration bandwagon. These turkeys are voting for Thanksgiving: Current immigration-driven demographic drift—especially after this week’s elections—is suicidal for the GOP.


 Morgan, right, criticized Congress for failing to enact legislation to reform the U.S. immigration system:


