The U.S. added 224,000 new jobs last month, rebounding from a recent lull and calming worries about the health of an economy now entering a record 11th year of expansion. The increase in new payroll jobs easily beat the 170,000 consensus of Wall Street economists polled by MarketWatch. The “other” employment survey, of Households rather than businesses, was in broad agreement, reporting an overall job gain of 247,000. But overhanging this strong economy: immigration, legal and illegal, is surging. What happens if—and when—there’s a cyclical downturn?
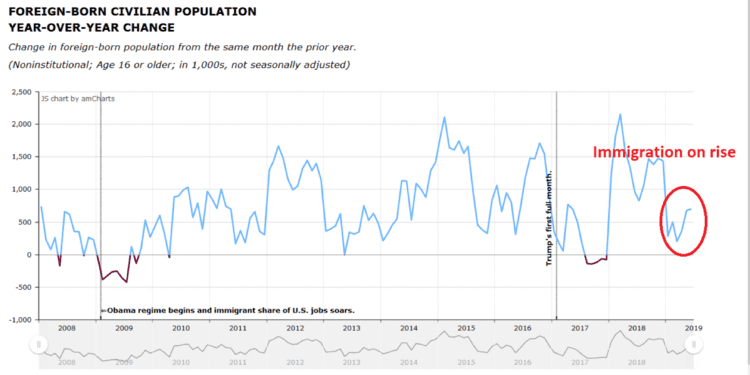
The foreign-born working-age population was up by 702,000, or 1.65%, from the prior June.
While “only” 16.6% of the U.S. working-age population is foreign-born, they accounted for more than half (50.2%) the rise in working age population over this period.
Nota bene: about 300,000 immigrants die every year, and another 300,000 return home voluntarily. So the 702,000 net rise in adult immigrant population reported by BLS for the past 12 months translates to about 1.3 million immigrants entering the country over that time. That’s well above the 800,000 to 1 million legal influx reported by Homeland Security.
Either DHS wrong—or illegals are pouring in at unprecedented rates.
That’s certainly what the latest available South West Border Patrol Apprehensions and Inadmissables data seems to show (although there are rumors June’s will show a decline following Trump’s tariff threats).
Over the past 12 months wages were up 3.1%, a notch below market forecasts of 3.2%. Inflationary pressures remain at bay. For years wage increases have been tepid even as the economy added jobs and unemployment continued falling. But now employees finally appear to be getting raises.
Note, however, that these recent gains look distinctly less impressive in a longer-term perspective.
And, as brought out in the Economic Policy Institute graphic below, the hikes in nominal wage growth, although returning to pre-Great Recession levels, are still below the Federal Reserve’s target for non-inflationary wage growth:
![]()
What about American worker displacement? For the second consecutive month, our analysis reveals a bifurcated result, with native-born Americans gaining positions while immigrants were losing them.
In June:
- Native-born Americans gained 357,000 jobs, a gain of 0.3%
- Immigrants lost 110,000 jobs, a 0.4% reduction
- The VDARE.com immigrant employment index, set at 100.0 in January 2009, fell to 127.0 from 127.5 in May
- The Native-born American employment index rose to 107.4 from 107.1 in May
- The New VDARE American Worker Displacement Index (NVDAWDI), our name for the ratio of immigrant to native-born employment growth indexes since Jan. 2009, fell to 118.3 from 119.1 in May.
But while American Worker Displacement fell last month, it still ranked eighth highest among the 126 months we’ve tracked since January 2009. The all-time displacement high, 123.0, was set in April of last year—well into Trump territory.
(Note that the previous June also saw a significant decline in American Worker Displacement. So there may be seasonal factors at work in the May to June period that obscure longer-term trends).
The long term trend remains all too clear: Native-born American workers lost ground to their foreign-born competitors throughout the Obama years; this accelerated significantly in the months leading up to the 2016 election. And more than half way through his first term, President Trump has not yet reversed this trend.
From January 2017 through June 2019, Trump has presided over a labor market in which immigrants gained 1.5 million jobs, a 5.8% increase, while native-born Americans gained 3.4 million, a rise of 2.7%. As far as job growth is concerned, “America First” has not translated into Americans First.
Another way of looking at American worker displacement: the immigrant share of total U.S. employment.
Immigrants held 17.52% of jobs in June, down from 17.61% in May and 18.06% in April, but well above the 17.34% share of jobs they held last June. These numbers are not seasonally adjusted, so year-over-year comparisons are likely more representative of the long-term trend. The record immigrant job share—18.08%—was recorded in April 2018.
Year-over-year comparisons are presented in the table below, from the Employment Status of the Civilian Population by Nativity table published in the monthly BLS Report. It shows immigrants gained jobs at nearly 3 times the rate of native-born Americans over the past 12 months.
|
Employment Status by Nativity, June 2018-June 2019
|
|
(numbers in 1000s; not seasonally adjusted)
|
|
|
Jun-18
|
Jun-19
|
Change
|
% Change
|
|
|
Foreign born, 16 years and older
|
|
Civilian population
|
42,514
|
43,216
|
702
|
1.65%
|
|
Civilian labor force
|
28,115
|
28,421
|
306
|
1.09%
|
|
LF Participation rate (%)
|
66.1
|
65.8
|
-0.3 %pts.
|
-0.45%
|
|
Employed
|
27,134
|
27,643
|
509
|
1.88%
|
|
Employment/population (%)
|
63.8
|
64.0
|
0.2 %pts.
|
0.31%
|
|
Unemployed
|
981
|
778
|
-203
|
-20.69%
|
|
Unemployment rate (%)
|
3.5
|
2.7
|
-0.8 %pts.
|
-22.86%
|
|
Not in labor force
|
14,399
|
14,796
|
397
|
2.76%
|
|
|
Native born, 16 years and older
|
|
Civilian population
|
215,128
|
215,821
|
693
|
0.32%
|
|
Civilian labor force
|
135,162
|
135,699
|
537
|
0.40%
|
|
LF Participation rate (%)
|
62.8
|
62.9
|
0.1 %pts.
|
0.16%
|
|
Employed
|
129,331
|
130,185
|
854
|
0.66%
|
|
Employment/population (%)
|
60.1
|
60.3
|
0.2 %pts.
|
0.33%
|
|
Unemployed
|
5,831
|
5,514
|
-317
|
-5.44%
|
|
Unemployment rate (%)
|
4.3
|
4.1
|
-0.2 %pts.
|
-4.65%
|
|
Not in labor force
|
79,966
|
80,122
|
156
|
0.20%
|
|
Source: BLS, The Employment Situation June 2019, Table A-7, July 5, 2019..
|
|
PDF
|
Over the past 12 months (June 2018 to June 2019):
- Immigrant employment rose 1.88%; native-born American employment was up 0.66%. IMMIGRANT EMPLOYMENT GREW AT NEARLY THREE TIMES THE RATE OF NATIVE-BORN AMERICANS
- The unemployment rate for immigrant workers fell to 2.7%, a whopping 23% decline from last June; native-born Americans saw a comparatively modest decline to 4.1%. ADVANTAGE IMMIGRANTS
- The immigrant labor force (employed plus looking for work) rose 1.09%; the native-born labor force grew 0.40%—ADVANTAGE IMMIGRANTS, POSSIBLY ATTRIBUTABLE TO THE CURRENT CROSS-BORDER SURGE IN ILLEGAL ECONOMIC MIGRANTS SEEKING JOBS
- The Labor Force Participation Rate, a sign of worker confidence and mobility, fell by 0.3 points, to 65.8%, for immigrants, but was up by 0.1 points, to 62.9%, for native-born Americans. That’s good news—the past few months of fairly strong wage gains appear to have drawn more natives into the labor force—and bad news: the influx of native-born job seekers has prevented native born unemployment rates from falling as much as those of immigrants. They will find jobs if (only if?) the foreign influx is controlled and reversed. ADVANTAGE (AT LEAST TEMPORARILY) FOR IMMIGRANTS
Bottom line: This is a formidably strong economy and it is swamping (but not reversing) the effects of immigration, while at the same time drawing more immigrants in. The downside of this will emerge in the next cyclical downturn.
To repeat National Data’s traditional conclusion: Over the long haul, only legislation can protect American workers from displacement and wage depression. Trump lost his best chance to legislate patriotic immigration reform when the GOP lost the House. But he can still use the GOP Senate majority to “begin the conversation.”
Far from increasing immigration, he should demand an immigration moratorium.
A further thought: has everyone forgotten that the current immigration-driven demographic drift is suicidal for the GOP?
Edwin S. Rubenstein (email him) is President of ESR Research Economic Consultants.