Yes, Virginia, it’s a national emergency—December’s jobs report, widely hailed because of strong employment growth, also revealed a massive immigration influx, far in excess of estimated legal inflow. And native-born American worker displacement remains close to record highs, continuing an Obama-Era trend that the Trump Administration has totally failed to break. The strong economy is muffling the impact. But what when the next cyclical downturn arrives?
American worker replacements are entering the country in near-record numbers: the immigrant population of working age (16 years plus) increased by 1.439 million in December, the fifth consecutive month of 1 million+ growth.
There are seasonal trends at work here, of course, so it is particularly alarming that the year-over-year increase this December was larger than in any December since 2008.
With legal immigration running at about 1 million per annum, this figure implies a net illegal worker influx potentially in the hundreds of thousands. (In contrast, immigrant working age population actually shrank in the last five months of 2017 when the now-vanished “Trump Effect” seemed to be really taking hold.)
These are net figures. Over a 12-month period an average of about 300,000 immigrants die and an equal number leave the U.S. voluntarily. So December’s 1.439 million net rise in adult foreign-born population implies that an astonishing 2.039 million immigrants may have actually settled in the country over the past year. (This excludes tourists and other short-term entrants.)
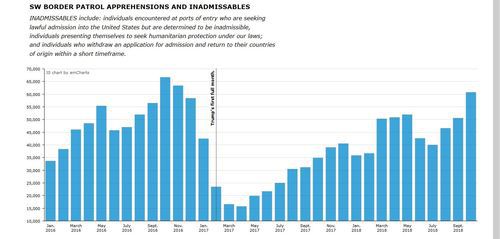
The Border Patrol website is down, a victim of the government shutdown, so December apprehension data are not available. (Yet BLS employment data are available. Apparently BP office personal are considered to be less vital to national security than BLS number crunchers. That makes no sense.)
But December news footage shows illegals swarming the border fence at Tijuana and other legal entry points. We have good reason to expect record apprehensions. Last month, the Border Patrol reported 62,456 illegal intruders were apprehended along the southern border, the highest monthly level of the Trump presidency.
![https://vdare.com/public_upload/publication/featured_image/46964/borderbar.jpg]()
Not since November 2016, when illegals feared a soon-to-be inaugurated Trump would clamp down hard, has the influx exceeded November’s total. So far none of the administration’s allegedly “hard line” policies—deploying thousands of troops to the border, limiting the cases for which illegals can request asylum—have deterred the influx.
Meanwhile, immigrants (legal and illegal, federal data doesn’t distinguish) accounted for more than half the growth of U.S. working-age population over the past 12 months. Over that period, the foreign-born working-age population grew 1.439 million, while the U.S.-born grew by 1.340 million. Note: More than 5 million native-born Americans were unemployed in December.
The Payroll Survey found robust job growth of 312,000 in December, nearly twice the 180,000 consensus forecast by economists. The “other” employment survey, of households rather than employers, found an comparatively anemic gain of 150,000 jobs in December.
Our analysis of the December Household Survey, which reports immigration status, found a welcome reversal from November, when native-born American employment fell and immigrants took all job growth. In December:
- Immigrant employment fell by 292,000 - down 1.1%
- Native-born employment rose 442,000 - up 0.3%
- The immigrant employment index, set at 100.0 in January 2009, fell to 126.9 from 128.3 in November.
- The native-born American employment index fell to 107.4 from 107.0 in November.
- The New VDARE American Worker Displacement Index (NVDAWDI), our term for the ratio of immigrant to native-born employment growth indexes, fell to 118.2 from 119.9 in October. The all-time displacement high, 123.0, was set in April.
Native-born American workers lost ground to their foreign-born competitors throughout the Obama years; this trend accelerated significantly in the months leading up to the 2016 election.
And Trump has still not broken this trend. Since taking office in January 2017, he has presided over a labor market in which immigrants have gained 1.49 million jobs, a 5.7% increase, while native-born Americans gained 3.376 million jobs—a rise of 2.7%. As far as the jobs are concerned, “America First” has not (yet) translated into Americans First.
Another way of looking at American worker displacement: the immigrant share of total U.S. employment.
Immigrants held 17.51% of all jobs in December, down from 17.71% in November. The all-time high (18.1%) was recorded in April 2018. December’s immigrant employment share ranks third-highest among the 120 months for which we have data.
A detailed snapshot of American worker displacement over the past year is available in the Employment Status of the Civilian Population by Nativity table published in the monthly BLS Report.
|
Employment Status by Nativity, Dec.2017-Dec.2018
|
|
(numbers in 1000s; not seasonally adjusted)
|
| |
Dec-17
|
Dec-18
|
Change
|
% Change
|
| |
Foreign born, 16 years and older
|
|
Civilian population
|
41,546
|
42,985
|
1,439
|
3.46%
|
|
Civilian labor force
|
27,143
|
28,359
|
1,216
|
5.30%
|
|
Participation rate (%)
|
65.3
|
66.0
|
0.7%pts.
|
1.07%
|
|
Employed
|
26,091
|
27,393
|
1,302
|
4.99%
|
|
Employment/population %
|
62.8
|
63.7
|
0.9 %pts.
|
1.43%
|
|
Unemployed
|
1,052
|
966
|
-86
|
-8.17%
|
|
Unemployment rate (%)
|
3.9
|
3.4
|
-0.5%pts.
|
-12.82%
|
|
Not in labor force
|
14,403
|
14,626
|
223
|
1.55%
|
| |
Native born, 16 years and older
|
|
Civilian population
|
214,563
|
215,903
|
1,340
|
0.62%
|
|
Civilian labor force
|
132,736
|
134,151
|
1,415
|
1.07%
|
|
Participation rate (%)
|
61.9
|
62.1
|
0.2%pts.
|
0.32%
|
|
Employed
|
127,510
|
129,088
|
1,578
|
1.24%
|
|
Employment/population %
|
59.4
|
59.8
|
0.4%pts.
|
0.67%
|
|
Unemployed
|
5,226
|
5,064
|
-162
|
-3.10%
|
|
Unemployment rate (%)
|
3.9
|
3.8
|
-0.1%pts.
|
-2.56%
|
|
Not in labor force
|
81,827
|
81,752
|
-75
|
-0.09%
|
|
Source: BLS, The Employment Situation-May 2018, Table A-7, January 4, 2019.
|
|
PDF
|
Over the past 12 months (December 2017 to December 2018):
- Immigrant employment rose 5.0%; native-born American employment was up 1.1%. ADVANTAGE IMMIGRANTS, though reduced from the multiples we saw earlier this year.
- The immigrant unemployment rate fell to 3.4%, a whopping 12.8% decline from the 3.9% rate of December 2017; the native-born unemployment rate fell to 3.8%, a 2.6% drop over that period. A win for immigrants–and a sharp contrast from November, when the native-born rate declined far more (year-over-year) than the immigrant rate. We had warned that this deterioration was likely given the high rates of native-worker displacement in the months prior to November.
- The immigrant labor force (employed plus looking for work) rose by 5.3%; the native-born labor force grew 1.1%—A FIVE-FOLD GROWTH ADVANTAGE FOR IMMIGRANTS. BAD, BUT NOT AS BAD AS THE SEVEN-FOLD YEAR-OVER-YEAR ADVANTAGE RECORDED IN NOVEMBER
- The Labor Force Participation Rate, a sign of worker confidence and mobility, rose by 0.7 points for immigrants, and 0.2 points for native-born Americans. ADVANTAGE IMMIGRANTS
- The number of native-born unemployed fell by 162,000—a 3.1% drop; immigrant unemployment fell by 86,000—an 8.2% reduction. ADVANTAGE IMMIGRANTS
Sign of the economy’s strength: wages, which for months only inched up, have begun to pick up more quickly. Year-over-year wage growth in December, at 3.2% percent, tied October for the highest gain since 2009. The recovery has gone on for so long that it has finally begun to lift the lowest-paid workers, who have seen the biggest gains, and African Americans, whose jobless rate has reached record lows.
But remember, even larger wage gains would have transpired had the immigrant share of employment not increased. Economist George Borjas estimates that every 10 percentage-point increase in the foreign-born share of employment reduces native wages by 3% to 4%. [ Immigration and the American Worker, by George Borjas, CIS.org, April 9, 2013, and Yes, Immigration Hurts American Workers , Politico, October 2016].
Since mid-2009 the foreign-born employment share has risen by about 2.5 percentage points—implying that wages would be about 1% higher than they are today had an immigration moratorium been in effect since then.
Over the long haul, only legislation can protect American workers from displacement and wage depression. Tragically, the Trump Administration has lost its chance to pass legislation easily now that Democrats have regained the House. But at least it can use the GOP Senate majority to “begin the conversation.”
How about suggesting an immigration moratorium?
Edwin S. Rubenstein (email him) is President of ESR Research Economic Consultants