January’s job report was widely acclaimed by the MSM. And why not? The economy added 304,000 jobs, despite headwinds from a government shutdown that halted wages for roughly 800,000 federal workers and sidelined more than one million private sector workers dependent on government contracts. (Federal employees are counted as furloughed rather than unemployed, because they are slated to receive pay for time lost. As a result, Federal employment held steady in January.)
And it’s not just jobs that look strong. Paychecks are growing. Hourly earnings climbed 3.2% in January from January 2018, and data released Thursday show that wages and salaries rose 3.1% in the final three months of 2018 compared to the same months the prior year.
Not since the end of the Great Recession a decade ago have wages risen like this.
Good—but not as good as it should be. Even larger wage gains would have transpired had the immigrant share of employment not increased. Economist George Borjas estimates that every 10 percentage-point increase in the foreign-born share of employment reduces native-born Americans’ wages by 3% to 4%. [Immigration and the American Worker, by George Borjas, CIS.org, April 9, 2013, and Yes, Immigration Hurts American Workers , Politico, October 2016]
Since mid-2009 the foreign-born employment share has risen by about 2.6 percentage points—implying that wages would be about 1% higher than they are today had an immigration moratorium been in effect since then.
“I think we’re in great shape right now,” Larry Kudlow, Trump’s top economic advisor, said Friday on Fox Business. “The USA is still the hottest economy in the world.” [U.S. economy added 304,000 jobs in January, shaking off the 35-day government shutdown, by Danielle Paquette, Washington Post, February 1, 2019]
Hottest economy in the world? Maybe. But exactly who in the U.S.A. is basking in the heat?
Kudlow, a longtime dogmatic immigration enthusiast miraculously Born Again as a loyal Trumpist, conveniently ignores job data from the “other” employment survey, of Households rather than Employers. The January Household Survey found a 251,000 drop in total employment from December.
The Household Survey is our sole source for job data on the immigration status of workers. Our analysis of the latest survey finds that immigrants gained jobs bigtime, while Native-Born Americans lost them.
In January:
- Immigrant employment rose by 212,000—up 0.8%
- Native-Born American employment fell 463,000—down by 0.4%
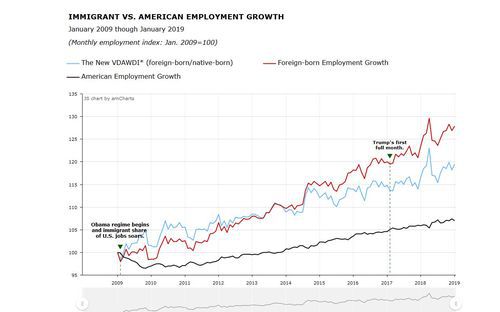
- The immigrant employment index, set at 100.0 in January 2009, rose to 127.9 from 126.9 in December.
- The Native-Born American employment index fell to 107.0 from 107.4 in December.
- The New VDARE American Worker Displacement Index (NVDAWDI), our term for the ratio of immigrant to native-born employment growth indexes, rose to 119.5 from 118.2 December. The all-time displacement high, 123.0, was set in April.
Native-born American workers lost ground to their foreign-born competitors throughout the Obama years; this trend accelerated significantly in the months leading up to the 2016 election. Half way through his first term, President Trump has still not broken this trend.
Since taking office in January 2017, he has presided over a labor market in which immigrants gained 1.7 million jobs, a 6.5% increase, while native-born Americans gained 2.9 million, a rise of 2.3%. As far as the jobs are concerned, “America First” has not (yet) translated into Americans First.
Another way of looking at American worker displacement: the immigrant share of total U.S. employment.
Immigrants held 17.67% of all jobs in January, up from 17.51% in December. The all-time high (18.1%) was recorded in April 2018. January’s immigrant employment share ranks third-highest among the 121 months for which we have data.
January is when population estimates for the Household Survey are updated. The changes reflect new information about net immigration, birth rates, death rates, as well as “…estimation methodology improvements.” Unfortunately, BLS does not update the Household Survey figures for December 2018 or earlier months. This creates a discontinuity in the monthly data available to us.
In December, we reported that the immigrant population of working age (16 years plus) increased by 1.439 million, the fifth consecutive month of 1 million+ growth. For what it’s worth, the figure for January is 284,000 – less than one-fifth the December influx.
As noted above, the January and December figures are not comparable. We are flying without a compass. A clearer picture of the immigrant population trend may emerge in later months of 2019.
There are seasonal trends at work here, of course, so it is particularly alarming that the year-over-year increase this December was larger than in any December since 2008.
With legal immigration running at about 1 million per annum, this figure implies a net illegal worker influx potentially in the hundreds of thousands. (In contrast, immigrant working age population actually shrank in the last five months of 2017when the now-vanished “Trump Effect” seemed to be really taking hold.)
These are net figures. Over a 12-month period an average of about 300,000 immigrants die and an equal number leave the U.S. voluntarily. So December’s 1.439 million net rise in adult foreign-born population implied that an astonishing 2.039 million immigrants may have actually settled in the country over the past year. (This excludes tourists and other short-term entrants.)
The Border Patrol website is still down. The latest BP data we have is for November, when 62,456 border crossers were apprehended.
Data blackout notwithstanding. there is good news to report. On January 24th the Trump Administration announced it would start blocking some asylum seekers from entering over the Mexican border. [U.S. to Begin Blocking Asylum Seekers From Entering Over Mexican Border , by Glenn Thrush, New York Times, January 24, 2019] The ban starts small, at the San Ysidro border crossing near San Diego, but will be expanded to heavily trafficked crossings along the entire border. That’s better than the current “catch and release” policy that allows asylum seekers to stay in the country until their cases are adjudicated, but not nearly as good as alternative protocols, especially those requiring that they stay in Mexico until their applications are thoroughly vetted.
Better still: A Wall. And perhaps cheaper, considering the ongoing expenditures required to house, vet, and weed out criminals, terrorists, and other undesirables from the throng of applicants.
If Trump’s protocol is rigorously implemented crossers will be deterred, and Border Patrol apprehensions should decline. An increase would signal either flaws in the new protocol, or a jump in demand for illegal alien workers on the part of U.S. employers. E-Verify would help with the latter; a Wall would help with both. We will monitor the data.
A detailed snapshot of American worker displacement over the past year is available in the Employment Status of the Civilian Population by Nativity table published in the monthly BLS Report:
|
Employment Status by Nativity, Jan. 2018-Jan. 2019
|
|
(numbers in 1000s; not seasonally adjusted)
|
|
|
Jan-18
|
Jan-19
|
Change
|
% Change
|
|
|
Foreign born, 16 years and older
|
|
Civilian population
|
42,625
|
42,909
|
284
|
0.67%
|
|
Civilian labor force
|
27,754
|
28,686
|
932
|
3.36%
|
|
Participation rate (%)
|
65.1
|
66.9
|
1.8
|
2.76%
|
|
Employed
|
26,453
|
27,381
|
928
|
3.51%
|
|
Employment/population %
|
62.1
|
63.8
|
1.7
|
2.74%
|
|
Unemployed
|
1,300
|
1,305
|
5
|
0.38%
|
|
Unemployment rate (%)
|
4.7
|
4.5
|
-0.2
|
-4.26%
|
|
Not in labor force
|
14,871
|
14,223
|
-648
|
-4.36%
|
|
|
Native born, 16 years and older
|
|
Civilian population
|
214,156
|
215,331
|
1,175
|
0.55%
|
|
Civilian labor force
|
132,283
|
133,419
|
1,136
|
0.86%
|
|
Participation rate (%)
|
61.8
|
62
|
0.2
|
0.32%
|
|
Employed
|
126,395
|
127,583
|
1,188
|
0.94%
|
|
Employment/population %
|
59
|
59.2
|
0.2
|
0.34%
|
|
Unemployed
|
5,889
|
5,835
|
-54
|
-0.92%
|
|
Unemployment rate (%)
|
4.5
|
4.4
|
-0.1
|
-2.22%
|
|
Not in labor force
|
81,872
|
81,912
|
40
|
0.05%
|
|
Source: BLS, The Employment Situation-January 2019, Table A-7, February 1, 2019.
|
|
PDF
|
Over the past 12 months (January 2018 to January 2019):
- Immigrant employment rose 3.5%; native-born American employment was up 0.9%. ADVANTAGE IMMIGRANTS, though reduced from the multiples we saw earlier this year.
- The immigrant unemployment rate fell to 4.5%, down by 4.3% from last year; the native-born unemployment rate fell to 4.4%, a. 2.2% drop over that period. A win for immigrants–although not nearly as dire as the divergence, year-over-year, last month, when immigrant unemployment rates fell 5-times faster than that of native-born.
- The immigrant labor force (employed plus looking for work) rose 3.4%; the native-born labor force grew 0.9%—A 3.8-FOLD GROWTH RATE ADVANTAGE FOR IMMIGRANTS, HORRIFIC, ALBEIT DOWN SLIGHTLY FROM DECEMBER’S 3.9-FOLD DIVERGENCE
- The Labor Force Participation Rate, a sign of worker confidence and mobility, rose by 1.8 points, or 2.8%, for immigrants, and by 0.2 points, or 0.3%, for native-born. ADVANTAGE IMMIGRANTS
- The number of native-born unemployed fell by 54,000—a 0.9% drop; immigrant unemployment rose by 5,000—a 0.4% increase. ADVANTAGE NATIVE-BORN Americams
Over the long haul, only legislation can protect American workers from displacement and wage depression. Tragically, the Trump Administration has lost its chance to pass legislation easily now that Democrats have regained the House. But at least it can use the GOP Senate majority to “begin the conversation.”
How about suggesting an immigration moratorium?
Edwin S. Rubenstein (email him) is President of ESR Research Economic Consultants