[Research by Edwin S. Rubenstein]
Well, that’s a relief: the Immigrant Displacement of American workers, which took all the jobs created last month paused in March. But the Immigrant Workforce Population is moving up again. And both at the southern border and in Congress, fanatical Biden immigration enthusiasts are organizing more to come.
The U.S. economy added a 916,000 jobs in March, up from 416,000 in February, according to the Payroll Survey released April 6. The “other” employment survey,” of Households rather than businesses, shows, by our calculations, a seasonally adjusted 609,000 job gain for March, with native-born America workers receiving most of the gain this time:
- Total employment rose by 609,000, a 0.41% gain from February.
- Immigrants (legal and illegal) lost 39,000 jobs, a 0.15% fall from February.
- Native-born Americans gained 648,000 positions, a 0.52% rise from February.
- Thus VDARE.com’s immigrant employment index, set at 100.0 in January 2009, fell to 119.9 from 120.0 in February, a 0.15% reduction.
- VDare’s Native-Born employment index rose to 103.6 from 103.1 in February, a 0.52% increase.
This means that the New VDARE American Worker Displacement Index (NVDAWDI), our name for the ratio of immigrant to native-born American employment growth indexes since Jan. 2009, fell to 115.7 from 116.5 in February, a 0.67% decline.
Note that this means American Worker Displacement is now back to a slightly higher level than it was when Donald Trump was inaugurated. After wild gyrations during his Administration, it finally fell, partly because of the pandemic and partly because of his Executive Actions. Now it will probably resume the relentless increase of the Obama years—unless the political climate changes again.
Economic trends rarely move in straight lines. Among many possible explanations for the March pause was the horrific weather, which may have depressed predominantly blue-collar immigrants’ employment more than that of their white-collar native-born counterparts, who can Zoom—thereby producing larger March job gains for the native-born.
Significantly, however, despite increased immigrant unemployment, the year-over-year rise in the foreign-born working-age population accelerated last month.
Note carefully what this chart shows. Unlike our other charts, which show absolute values, this one compares each month to the same month in the preceding year. So the immigrant workforce population grew by 736,000 in March 2021 compared to March 2020.
For most of 2020, the population of working-age immigrants declined Y-O-Y. This far exceeded the net exodus during the 2008 Great Recession, and the brief net exodus during Trump’s first year, when his mere presence seems to have jawboned illegals into fleeing.
The immigrant Work Force population started growing again only in December 2020—when the election results spurred a renewed invasion. Its full effect on displacement and wage rates have yet to be felt.
Another displacement metric—the immigrant share of total employment—fell slightly in March:
Our analysis shows 17.20% of March jobs were held by immigrants—slightly below February’s 17.30%. In March 2020 immigrants held 17.06% of jobs.
Note that, after some gyrations, the immigrant share of employment had been falling steadily even before the pandemic started. But, again, the Trump gains have been wiped out and the immigrant share will resume its Obama-Era upward march—unless the political climate changes again.
Each 1% rise in immigrant employment share represents a transfer of about 1.5 million jobs from native-born Americans to immigrants.
A more detailed picture of how American workers have fared vis-à-vis immigrants is published in Table A-7 of the monthly BLS Report:
|
Employment Status by Nativity, Mar. 2020-Mar. 2021
|
|
(numbers in 1000s; not seasonally adjusted)
|
|
|
Mar-20
|
Mar-21
|
Change
|
% Change
|
|
|
Foreign born, 16 years and older
|
|
Civilian population
|
42,323
|
43,059
|
736
|
1.74%
|
|
Civilian labor force
|
27,819
|
27,775
|
-44
|
-0.16%
|
|
Participation rate (%)
|
65.7
|
64.5
|
-1.2pts.
|
-1.83%
|
|
Employed
|
26,478
|
25,886
|
-592
|
-2.24%
|
|
Employment/population (%)
|
62.6
|
60.1
|
-2.5pts.
|
-3.99%
|
|
Unemployed
|
1,341
|
1,889
|
548
|
40.87%
|
|
Unemployment rate (%)
|
4.8
|
6.8
|
2.0pts.
|
41.67%
|
|
Not in labor force
|
14,504
|
15,285
|
781
|
5.38%
|
|
|
Native born, 16 years and older
|
|
Civilian population
|
217,435
|
217,944
|
509
|
0.23%
|
|
Civilian labor force
|
134,718
|
132,623
|
-2,095
|
-1.56%
|
|
Participation rate (%)
|
62.0
|
60.9
|
-1.1pts.
|
-1.77%
|
|
Employed
|
128,689
|
124,607
|
-4,082
|
-3.17%
|
|
Employment/population (%)
|
59.2
|
57.2
|
-2.0pts.
|
-3.38%
|
|
Unemployed
|
6,029
|
8,016
|
1,987
|
32.96%
|
|
Unemployment rate (%)
|
4.5
|
6.0
|
1.5pts.
|
33.33%
|
|
Not in labor force
|
82,717
|
85,321
|
2,604
|
3.15%
|
|
Source: BLS, The Employment Situation, March 2021. Table A-7, April 2, 2021.
PDF
|
From March 2020 to March 2021:
- The immigrant working age population rose by 736,000, a gain of 1.74%; the corresponding native-born population rose by 509,000—a rise of 0.23%. ADVANTAGE IMMIGRANTS, AS THEIR POPULATION OF WORKING AGE GREW MORE THAN 7 TIMES FASTER THAN THAT OF NATIVE-BORN AMERICANS.
- The pandemic lockdown started on March 12th, 2020, so it’s not surprising that both native-born and immigrants suffered substantial job losses, year-over-year. Immigrants lost 593,000 jobs, a 2.24% decline, while Native-born Americans lost 4.082 million, 3.17% decline. ADVANTAGE IMMIGRANTS
- The immigrant labor force (working or looking for work) fell by 44,000, or 0.16%; the native-born labor force fell by 2.095 million, a 1.56% drop. ADVANTAGE IMMIGRANTS.
- The unemployment rate for native-born Americans rose from 4.5% to 6.0%, a gain of 33.3%; the immigrant unemployment rate rose from 4.8% to 6.8%, a gain of 41.67%. ADVANTAGE NATIVE-BORN AMERICANS—PERHAPS REFLECTING, IN PART, THE RELATIVE EASE THAT OFFICE WORKERS COULD WORK REMOTELY OVER THE PAST YEAR.
- 8.0 million native-born, and 1.9 million immigrants, were unemployed in March 2021, but since last March the number of unemployed immigrants rose by 40.9%, while the number of native-born jobless rose by “only” 33%. ADVANTAGE NATIVE-BORN AMERICANS
- Labor Force Participation Rates [LPR] fell for both immigrants and native-born workers, with the immigrant LPR falling by 1.1 percentage points, or by 1.83%, while the native-born American rate fell by 1.8 percentage points, or 1.77%. ADVANTAGE NATIVE-BORN
The U.S. still has 8.4 million fewer jobs than it did before the pandemic. Even if employers kept hiring at the March pace, it would take months to return to the Trump era job peak.
More than 4 million people have been out of work for more than six months, a number that continued rising in March. The official jobless rate fell to 6% in March from a high of 14.8% in April, but this overstates the labor market’s healing. A more comprehensive unemployment metric, that adjusts for people who have left the labor force, shows that the “real” unemployment rate is around 9.1% in March [Americans Say They’re Primed to Spend More This Year, NYT, April 8, 2021].
Details of U.S. Customs and Border Protection data for March usually come out after the jobs data is released, but this month they were leaked to the Washington Post:
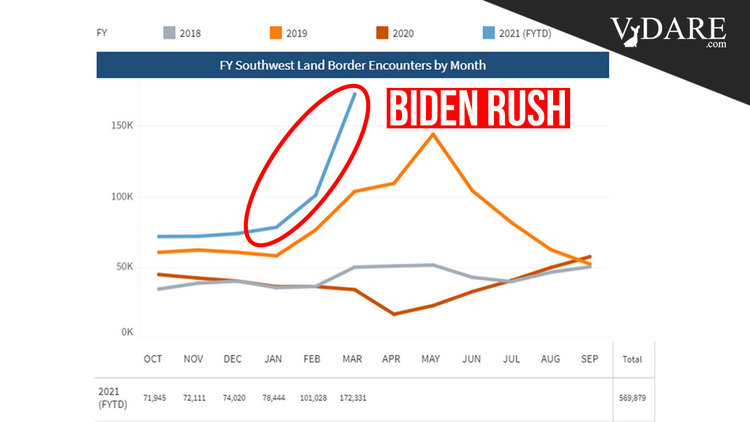
U.S. agents took more than 171,000 migrants [Regime Media-speak for illegal aliens] to custody last month, according to U.S. Customs and Border Protection figures that contradict Biden’s claims that his administration is facing an influx no different from previous years. The rapid increase in border arrests and detentions — which has more than doubled since January — underscores the magnitude of the challenge facing an administration that has promised more-humane and more-welcoming immigration policies.
[Border crossings in March jumped to highest level in 15 years, data shows, By Nick Miroff, April 2, 2021]
Many apprehended illegal aliens finish up in the U.S. anyway, of course, because the Biden Regime has reinstituted Obama’s catch-and-release policy. But CBP officials also estimate some 1,000 illegals a day are now sneaking into the U.S. without being caught at all, the highest figure in living memory [Border officials say more people are sneaking past them as crossings soar and agents are overwhelmed, by Nick Miroff, Washington Post, April 2, 2021].
All of this was perfectly predictable, of course, given the Biden Administration’s reflexive abandonment of the Trump Administration’s painfully assembled policies that finally got the border under control.
Equally predictable: the collision between American workers and the Biden Administration’s crazed drive to increase legal immigration in the teeth of massive unemployment. It has abandoned Trump’s temporary moratorium on legal immigration. Its proposed Amnesty/ Immigration Surge legislation amounts to a Great Replacement Acceleration Act and is clearly motivated by a determination to Elect A New People rather than economics. Now, incredibly, it appears all or part of it may be snuck through via a parliamentary maneuver [Democrats weigh reconciliation bill for immigration action, by Caroline Simon, Roll Call, April 7, 2021].
The disaster at the border suggests that the Biden administration is run by are fanatical ideologues who genuinely didn’t expect that reality would bite back. Reality will also bite back if they increase legal immigration. But the first casualties will be innocent ordinary Americans.
BREAKING: The Border Patrol border crossing data just released today (April 8)
![]()
Southwest Land Border Encounters, CBP, April 8, 2021
Earlier, from the Washington Post: Border officials say more people are sneaking past them as crossings soar and agents are overwhelmed, by Nick Miroff, April 2, 2021