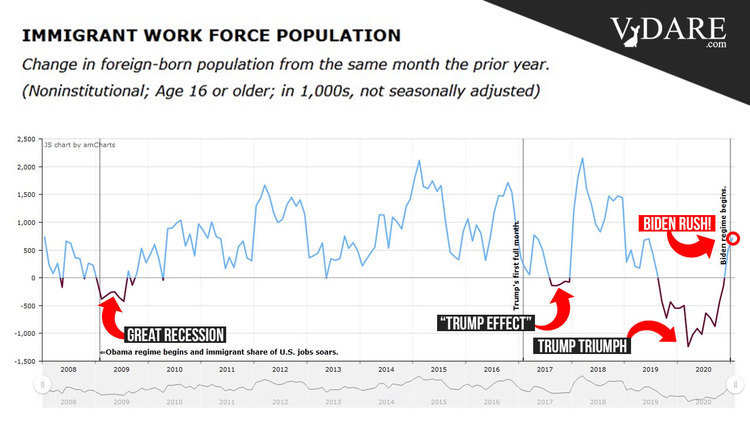
Joe Biden has been in the White House for a few weeks, but his impact on immigration has already been dramatic. The Immigrant Workforce Population (legal and illegal, federal data doesn’t distinguish) surged for the second straight month after 15 months of decline, immigrant displacement of American workers continued, and illegal border crossings increased—even before his dismantling various Trump protections has really had time to take effect. Biden may not know what to do about Covid or the economy, but he does know how to Elect A New American People.
The most troubling news for immigration patriots: the abrupt post-election end to the 15-month net exodus of working-age immigrants seen in December has been confirmed in January. The Immigrant Workforce Population grew by 724,000 in January year over year.
The decline in immigrant workers during the 15 month-long “Trump Triumph” (September 2019 through November 2020) was striking—much greater than we saw in the 2008 Great Recession. And of course, the Trump Triumph decline dwarfed the brief “Trump Effect” decline seen earlier in the Trump Administration.
It was remarkable achievement—but, alas, not institutionalized by statute and thus easily reversed.
Remember, immigration is the ultimate form of voter fraud.
Also troubling, illegal immigration across the southern border seems to be surging again.
The Trump Administration had a lot of trouble getting the illegal inflow under control, basically because of sabotage by Leftist judges. But it eventually succeeded, Now that achievement, too, is being reversed.
The Biden elect-a-new-people Rush is being enabled at a particularly bad time for American workers, not that Democrats care about them anymore. The American economy produced little relief in Joe Biden’s inaugural month. Employer payrolls, which had been expected to grow by 105,000 in January, rose by just 49,000.
The national unemployment rate did decline unexpectedly in January, but the drop primarily reflects a reduction in the Labor Force Participation Rate [LPR]. The civilian labor force—people working or looking for work—fell by 400,000 last month.
Somewhat better news was in the “other” employment survey, of Households rather than Businesses. Job growth there was four times larger than that reported in the business payroll survey. But the Household Survey reports immigrant status—and it shows that immigrants are edging out American workers.
Our analysis of the January Household Survey finds:
- Total employment rose by 201,000, a 0.13% increase from December.
- Immigrants (legal and illegal) gained 50,000 jobs, up 0.20% from December.
- Native-born Americans gained 151,000 jobs, up 0.12% from December.
- VDARE.com’s immigrant employment index, set at 100.0 in January 2009, rose to 118.3 from 118.0 in December, a 0.2% rise.
- The native-born American employment index rose to 103.2 from 103.1 in December, a 0.1% increase. At 103.2, the January index indicates that 3.2% more native-born workers held jobs last month than in January 2009, Obama’s first year in office.
This means that the New VDARE American Worker Displacement Index (NVDAWDI), our name for the ratio of immigrant to native-born American employment growth indexes since Jan. 2009, rose to 114.6 from 114.5 in December, a 0.1% rise.
Displacement is, of course, a relative term. It measures immigrant job growth relative to that of American native-born workers. Thanks, in part, to Trump’s (relatively) hard line on immigration, expressed via administrative measures, the Trump years saw a labor market where native-born Americans first held the line and then, in the COVID contraction, lost relatively fewer jobs than immigrants.
A mirror-image scenario may be playing out in Biden’s first few months.
Another way of measuring displacement: the immigrant share of total employment.
Our analysis of the January report shows the immigrant share of total employment rose to 17.06% from 17.05% in December. After some gyrations, it had been falling steadily before the pandemic started. In February 2020 immigrants held 17.53% of all jobs.
This is small, but the direction is significant. Each 1% decline in immigrant employment share represents a transfer of about 1.5 million jobs from immigrants to native-born American workers.
A more detailed picture of how American workers have fared vis-à-vis immigrants is published in Table A-7 of the monthly BLS Report:
|
Employment Status by Nativity, Jan.2020-Jan. 2021
|
|
(numbers in 1000s; not seasonally adjusted)
|
|
|
Jan-20
|
Jan-21
|
Change
|
% Change
|
|
|
Foreign born, 16 years and older
|
|
Civilian population
|
42,362
|
43,086
|
724
|
1.71%
|
|
Civilian labor force
|
28,189
|
27,549
|
-640
|
-2.27%
|
|
Participation rate (%)
|
66.5
|
63.9
|
-2.6pts.
|
-3.91%
|
|
Employed
|
27,066
|
25,318
|
-1,748
|
-6.46%
|
|
Employment/population (%)
|
63.9
|
58.8
|
-5.1pts.
|
-7.98%
|
|
Unemployed
|
1,124
|
2,231
|
1,107
|
98.49%
|
|
Unemployment rate (%)
|
4.0
|
8.1
|
4.1pts.
|
102.50%
|
|
Not in labor force
|
14,173
|
15,537
|
1,364
|
9.62%
|
|
|
Native born, 16 years and older
|
|
Civilian population
|
217,139
|
217,765
|
626
|
0.29%
|
|
Civilian labor force
|
135,308
|
131,685
|
-3,623
|
-2.68%
|
|
Participation rate (%)
|
62.3
|
60.5
|
-1.8pts.
|
-2.89%
|
|
Employed
|
129,928
|
123,065
|
-6,863
|
-5.28%
|
|
Employment/population (%)
|
59.8
|
56.5
|
-3.3pts.
|
-5.52%
|
|
Unemployed
|
5,380
|
8,620
|
3,240
|
60.22%
|
|
Unemployment rate (%)
|
4.0
|
6.5
|
2.5pts.
|
62.50%
|
|
Not in labor force
|
81,831
|
86,081
|
4,250
|
5.19%
|
|
Source: BLS, The Employment Situation, January2021. Table A-7, February 5, 2021.
PDF
|
From January 2020 to January 2021:
The native-born American working-age population rose by 626,000, a gain of 0.29%; the corresponding immigrant population rose by 724,000 — a 1.71% rise ADVANTAGE IMMIGRANTS.
Both native-born American and immigrants suffered large job losses, year-over-year; native-born Americans lost 6.86 million positions, a 5.3% decline, while foreign-born workers lost 1.75 million jobs, a 6.5% loss. ADVANTAGE NATIVE-BORN AMERICANS.
The Immigrant Labor force (working or looking for work) fell by 640,000, or 2.27%; the native-born American Labor Force fell by 3.623 million, a 2.68% drop. ADVANTAGE IMMIGRANTS.
The unemployment rate for native-born Americans rose 62.5%, from 4.0% to 6.5%; the immigrant unemployment rate rose 102.5%, from 4.0% to 8.1%. ADVANTAGE NATIVE-BORN AMERICANS.
8.62 million native-born, and 2.23 million immigrants were unemployed in December, but since last December the number of unemployed immigrants rose by 98.5%, while the number of native-born jobless rose by “only” 60.2%. ADVANTAGE NATIVE-BORN AMERICANS.
Labor force Participation Rates fell for both immigrants and native-born Americans, with the immigrant LPR falling by 2.6 percentage points, or by 3.9%, while the native-born American rate fell by 1.8 percentage points, or 2.9%. ADVANTAGE NATIVE-BORN AMERICANS.
For years immigrant unemployment rates were lower than those of native-born. This is no longer the case. Immigrants are overrepresented in retail, hotel, and warehousing jobs where telecommuting or zooming is not an option. As a result, the immigrant unemployment rate in January 2021, 8.1%, is considerably above the 6.5% rate of native-born Americans. This occurred despite the fact that the number of immigrants “Not in labor force”—and therefore not counted as unemployed—grew nearly twice as fast as the number of native-born in that category.
The pandemic will end. Eventually. The Democratic Party’s desire for immigrant workers a.k.a. voters is only just beginning.
Watch this space for even more dramatic evidence of immigration treason in the months ahead.
Edwin S. Rubenstein (email him) is President of ESR Research Economic Consultants