Job watchers held their breath when the March numbers were released at 8:30 AM last Friday. After an unexpectedly weak February—just 20,000 new jobs were initially reported—fears surfaced that the historic wave of hiring might be coming to an end. But employment surged again, with 196,000 new jobs created in March according to the Payroll Survey of businesses. Note, however, the “other” employment survey is not so sanguine. The Household Survey reports a net job loss of 201,000 in March. More on this below.
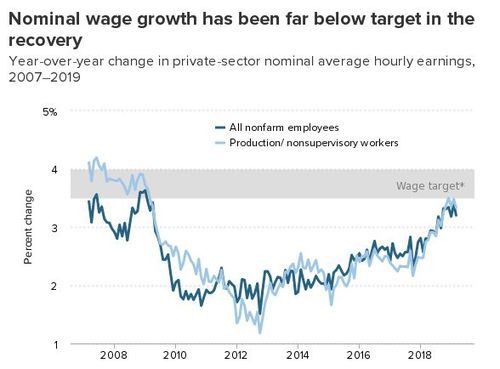
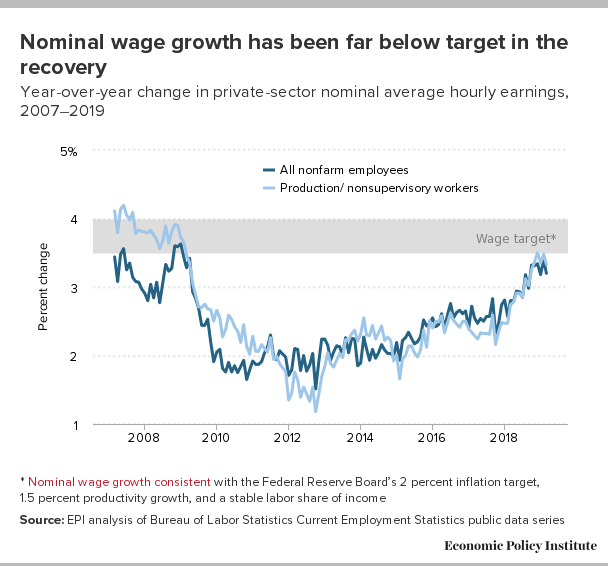
The best news in the March report: wage growth. For years wage increases have been tepid even as the economy added jobs and unemployment continued falling. But now employees finally appear to getting solid raises. Nominal (not inflation-adjusted) hourly wages in March 2019 were 3.2% above those of a year earlier, slightly lower than the 3.4% growth in February, but still roughly double annual inflation.
This tightening labor market, of course, is the reason President Javanka has apparently prevailed on Donald J. Trump to talk of increasing legal immigration, contrary to his campaign promises. (Although recent news seems more hopeful).
But, as brought out in the Economic Policy Institute graphic below, these annual hikes in nominal wage growth, although returning to pre-Great Recession levels, are still below the Federal Reserve’s target for non-inflationary wage growth:
![epigraph]()
So the Leftist EPI and the studiously impartial National Data agree: wage growth is now recovering—but not as good as it should be. What EPI won’t tell you: Immigration may be the reason. Even larger wage gains would have transpired had the immigrant share of employment not increased. Economist George Borjas estimates that every 10 percentage-point increase in the foreign-born share of employment reduces native-born Americans’ wages by 3% to 4%. [Immigration and the American Worker, by George Borjas, CIS.org, April 9, 2013, and Yes, Immigration Hurts American Workers , Politico, October 2016]
Since February 2009 the foreign-born share of employment has risen by about 2.8 percentage points—implying that wages would be growing about 1 percentage point above the 3.2% to 3.4% rate of recent months had an immigration moratorium been in effect since then.
In other words, the past 10 years of immigration have deprived American workers of a 33% wage hike.
March was one of the rare months when immigrants (legal and illegal) lost ground compared to native-born American workers:
- Immigrants lost 127,000 jobs, a 0.5% decline
- Native-Born Americans lost 74,000 jobs, a 0.1% decline
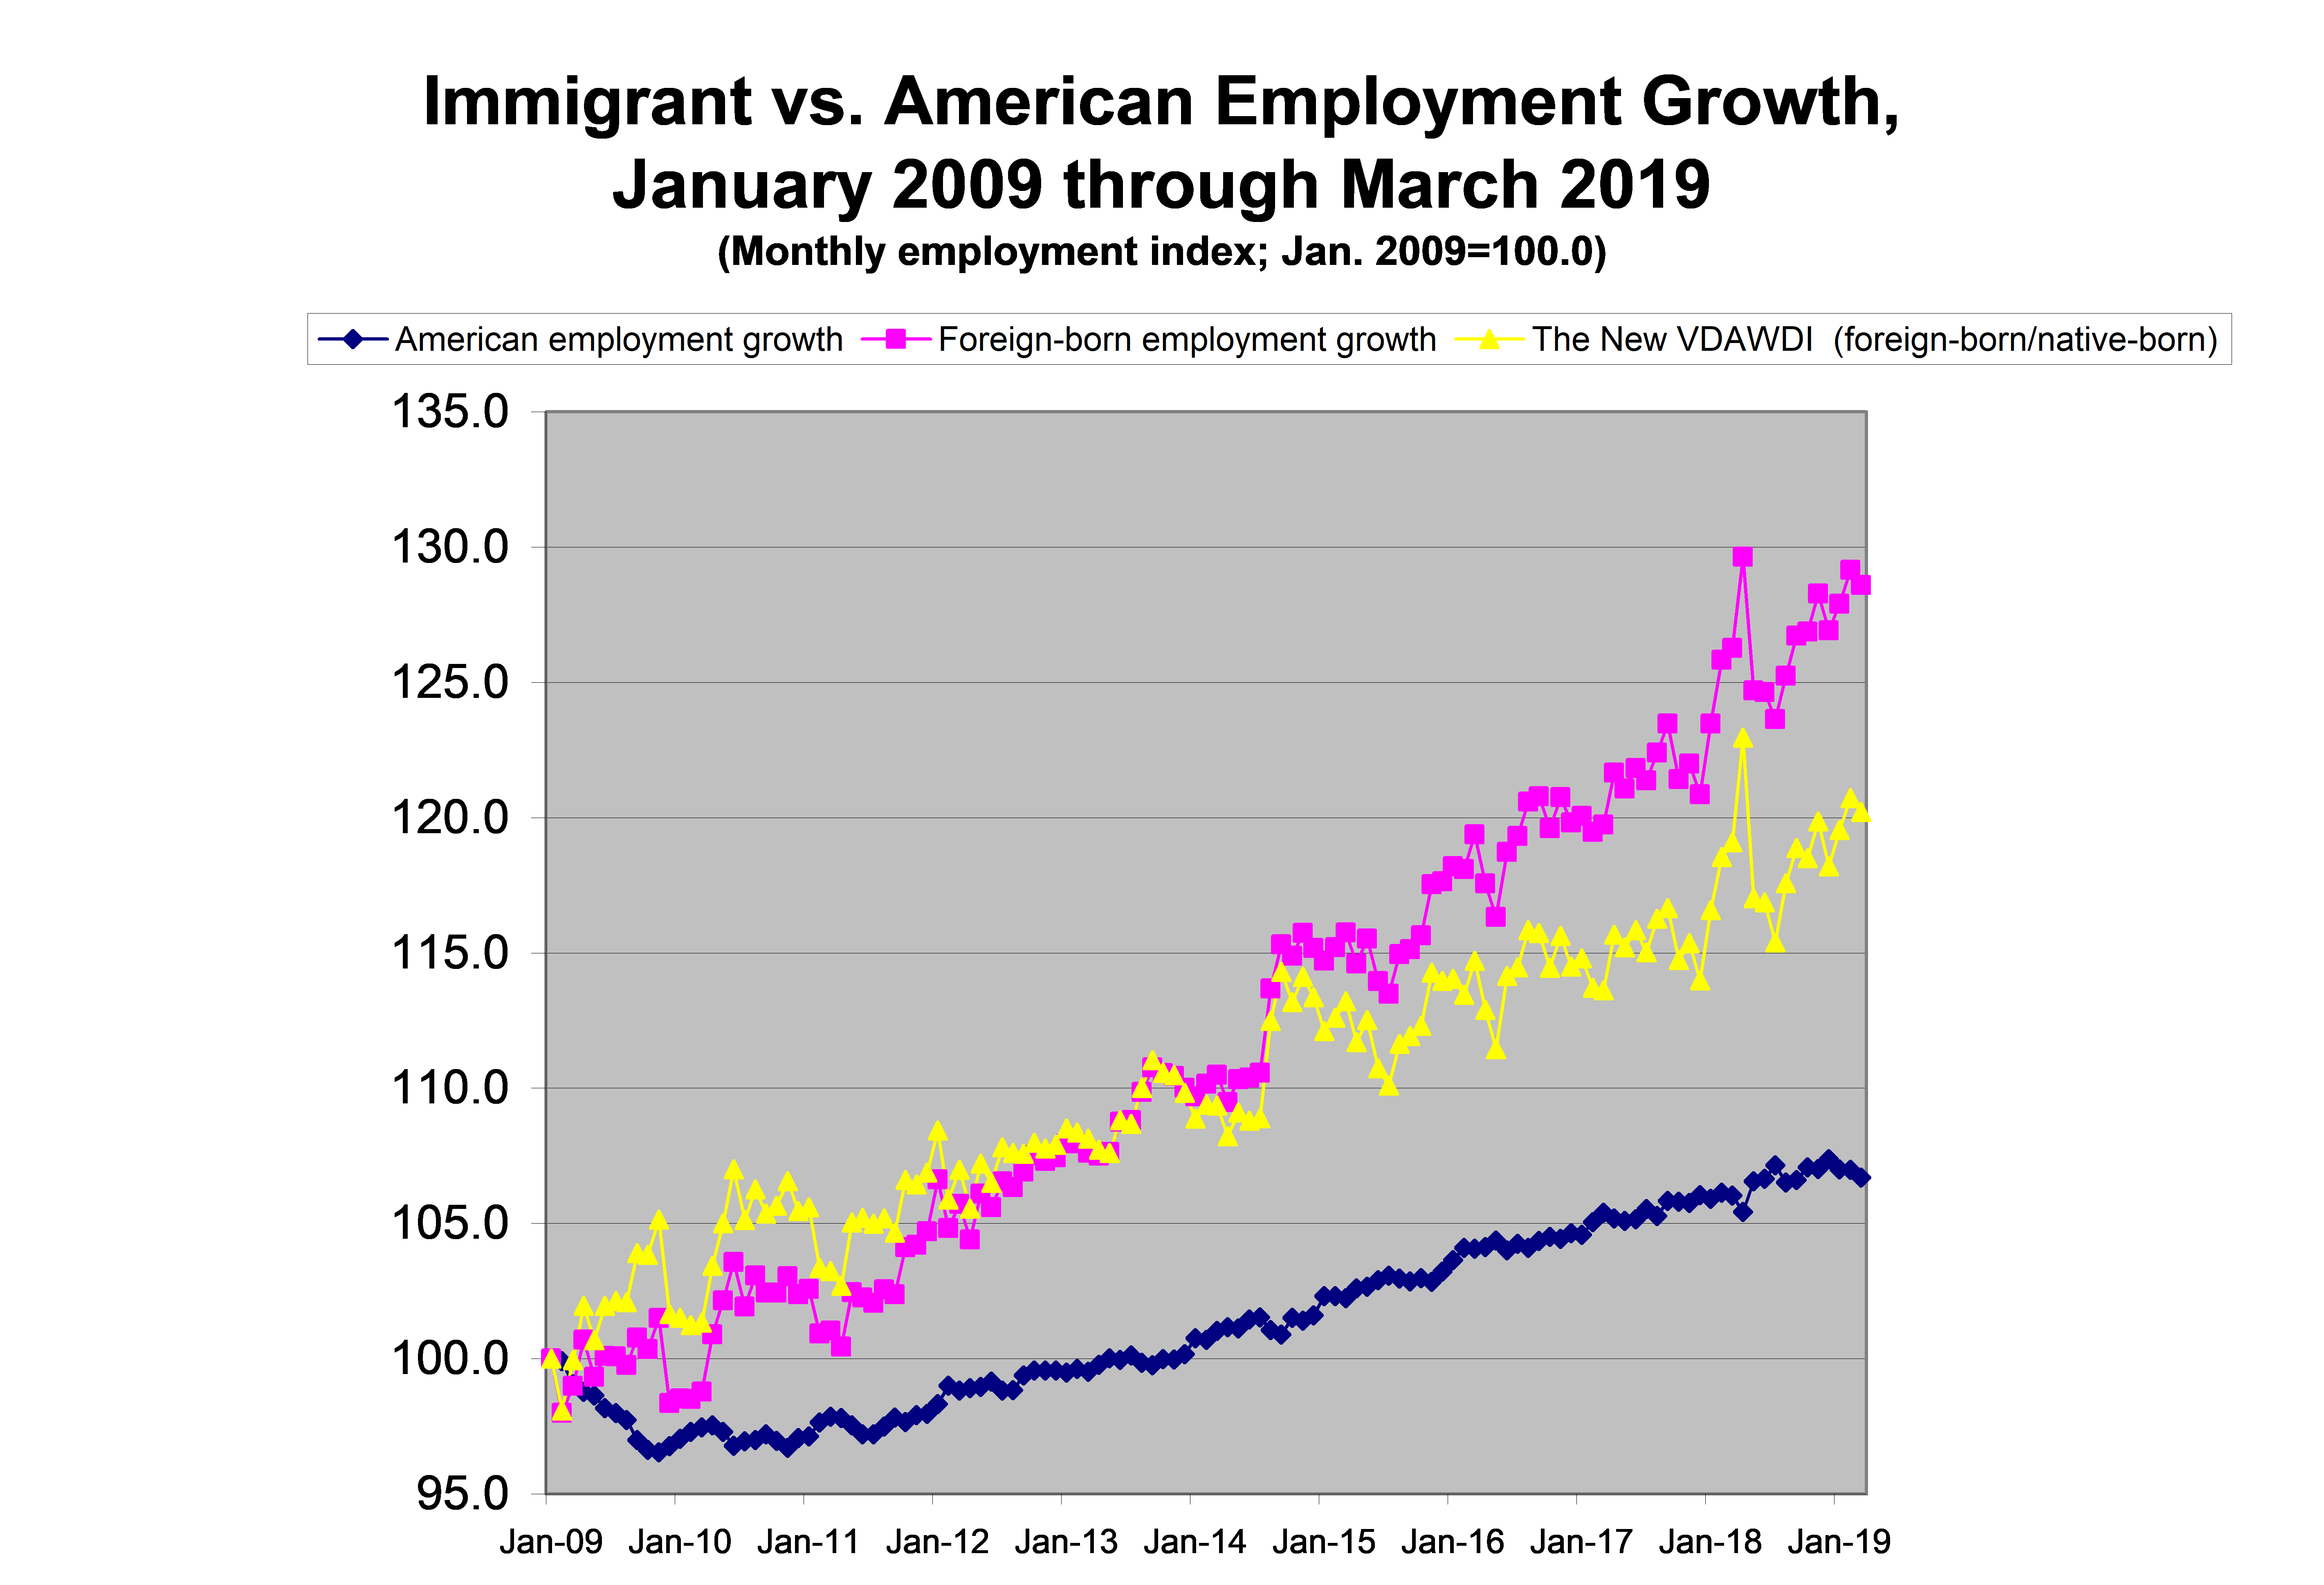
- The immigrant employment index, set at 100.0 in January 2009, fell to 128.6 in March from 129.1 in February.
- The Native-Born American employment index fell to 106.9 in March from 107.0 in February.
- The New VDARE American Worker Displacement Index (NVDAWDI), our name for the ratio of immigrant to native-born employment growth indexes, fell to 120.2 from 120.7 in February. Despite the modest decline, displacement in March 2019 was third highest among the 123 months we’ve tracked since January 2009. The second highest was February 2019, and all-time displacement high, 123.0, was set in April 2018—an anomalous reading, we believe. (See the spike in the NEW VDAWDI graphic below.)
Overall, Native-born American workers lost ground to their foreign-born competitors throughout the Obama years; this accelerated significantly in the months leading up to the 2016 election. More than half way through his first term, President Trump is still very far from breaking the trend:
![Immigration Vs.]()
Since taking office in January 2017, he has presided over a labor market in which immigrants gained 1.84 million jobs, a 7.1% increase, while native-born Americans gained 2.8 million, a rise of 2.2%.
As far as the jobs are concerned, “America First” has not translated into Americans First.
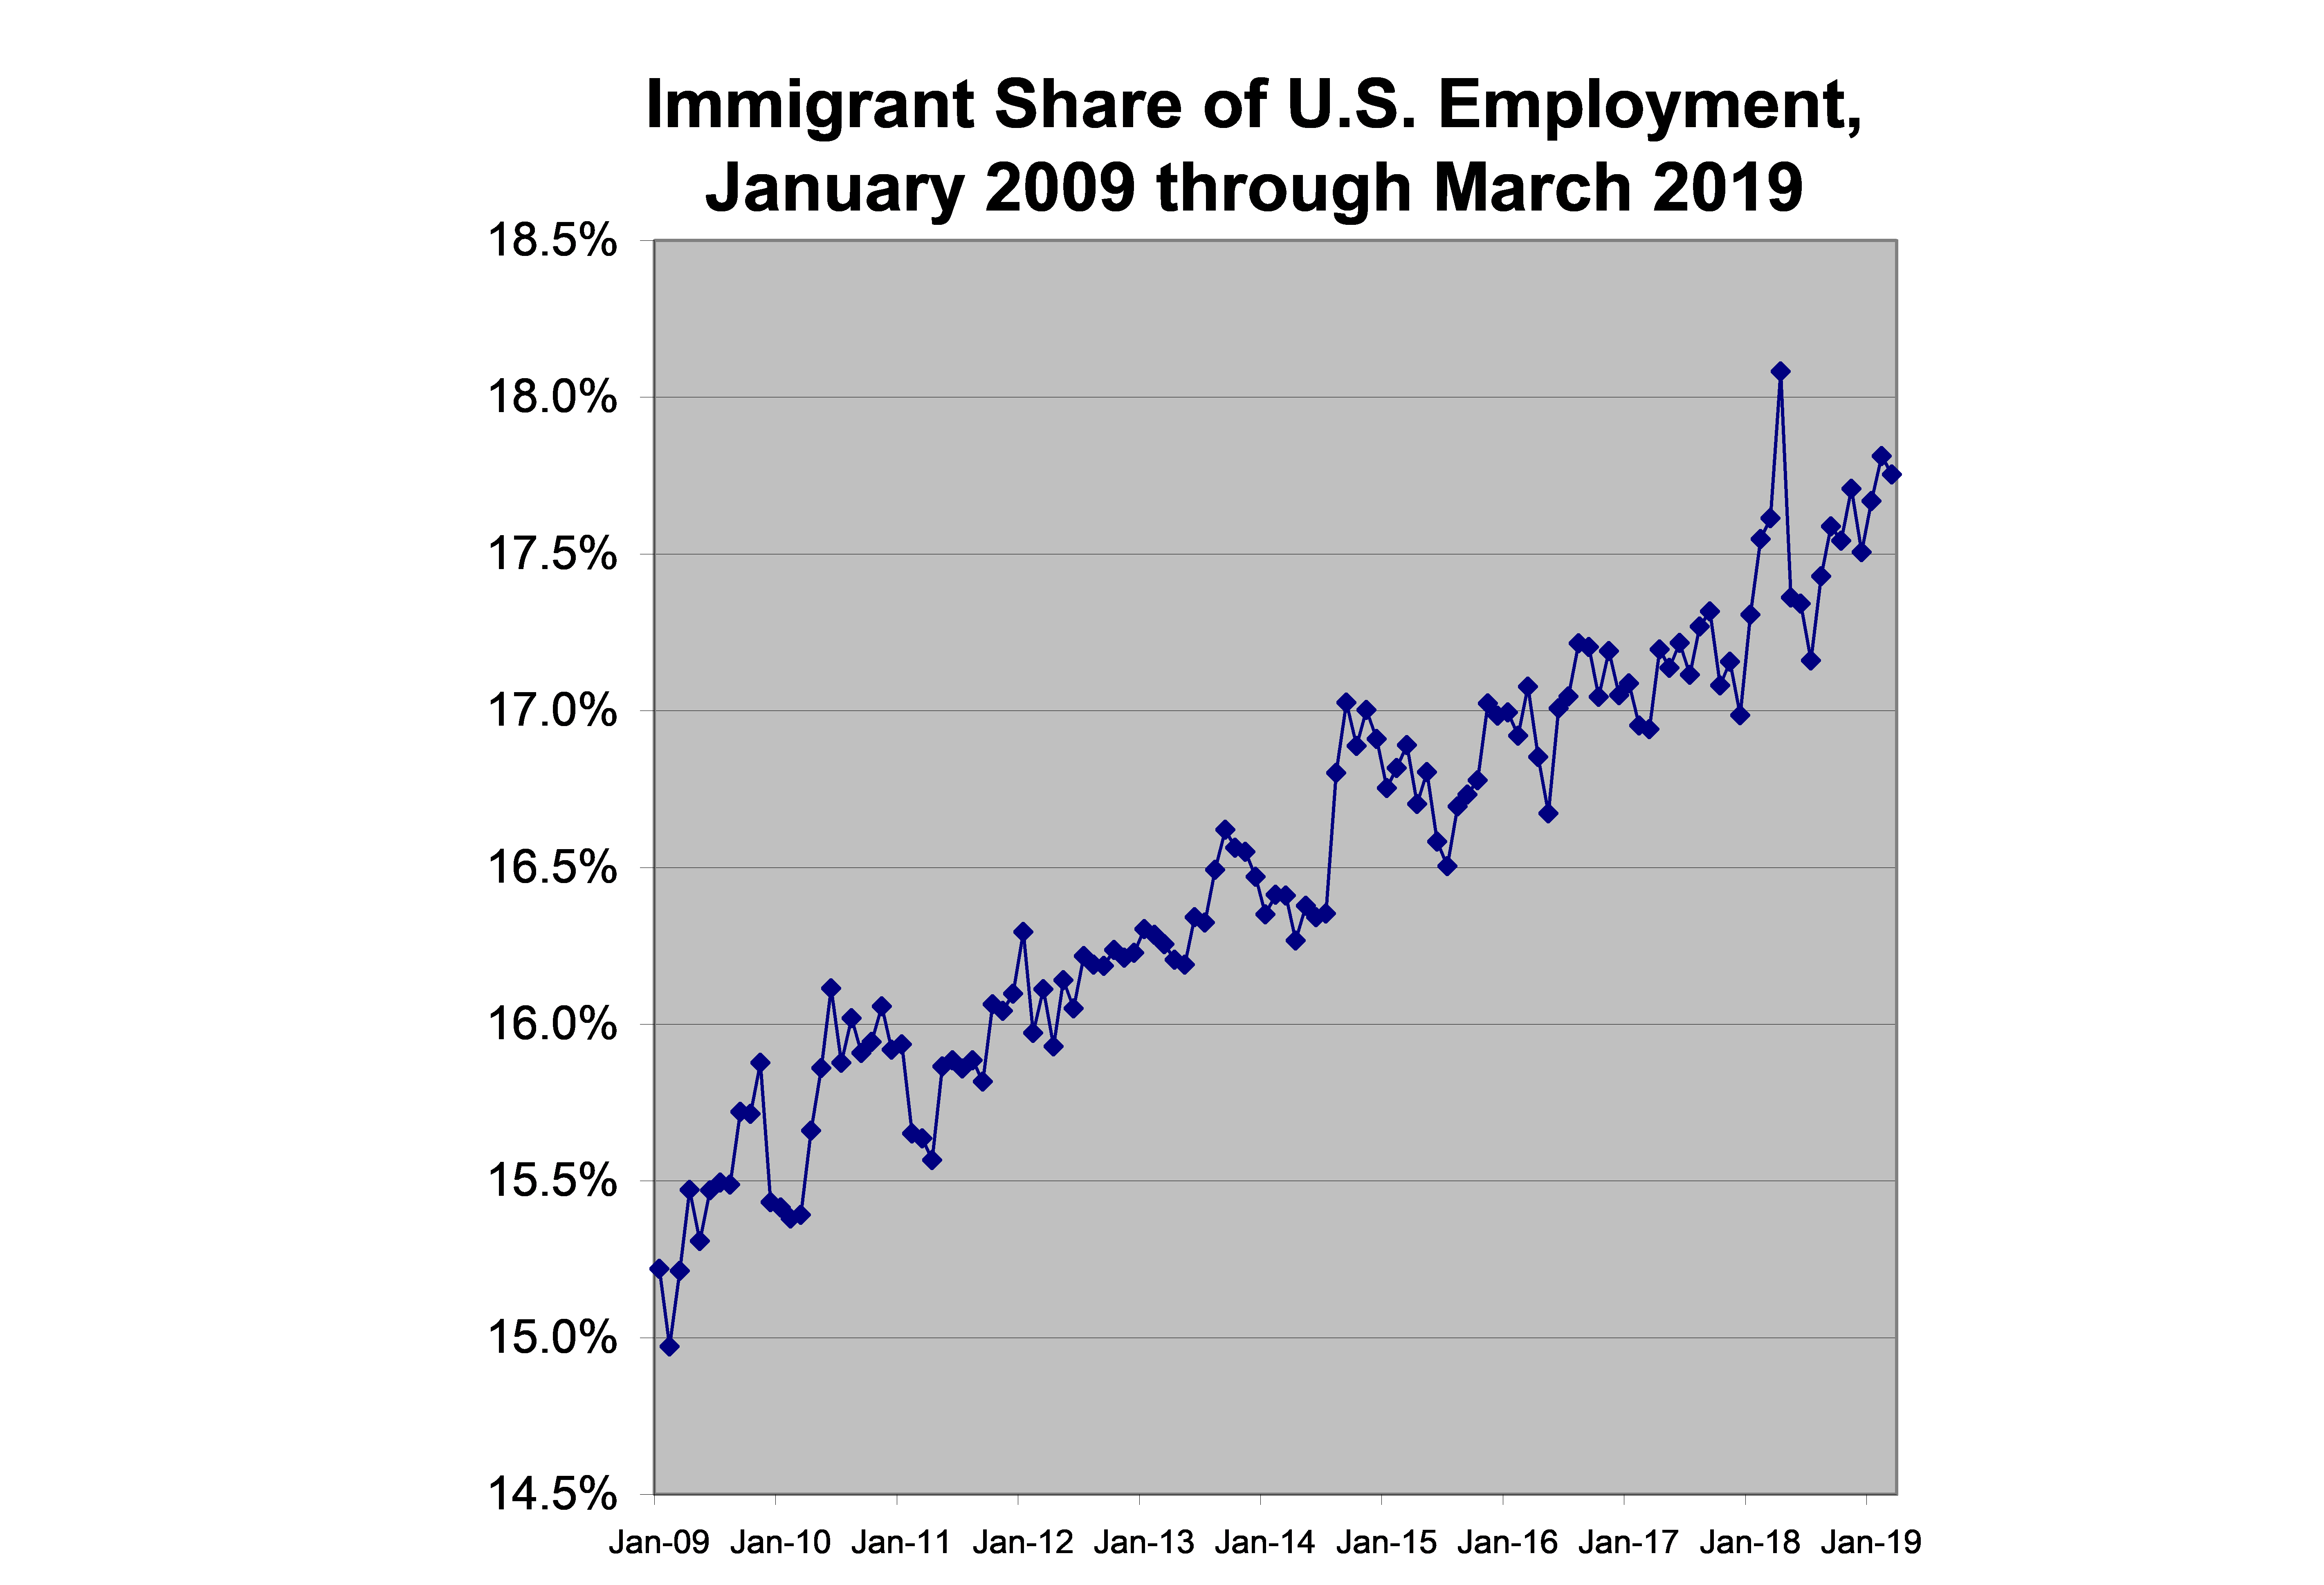
Another way of looking at American worker displacement: the immigrant share of total U.S. employment.
![immshare]()
Immigrants held 17.54% of all jobs in March, down slightly from 17.81% in February. March’s immigrant share ranks third among the 123 months for which we have data, second only to February and the April 2018 spike that hovers over the far right of the graphic. (The New VDARE American Worker Displacement Index (NVDAWDI) and the Immigrant Share of U.S. Employment move in tandem)
A detailed picture of American worker displacement over the past year is available in the Employment Status of the Civilian Population by Nativity table published in the monthly BLS Report:
|
Employment Status by Nativity, March 2018-March 2019
|
|
(numbers in 1000s; not seasonally adjusted)
|
|
|
Mar-18
|
Mar-19
|
Change
|
% Change
|
|
|
Foreign born, 16 years and older
|
|
Civilian population
|
43,358
|
43,562
|
204
|
0.47%
|
|
Civilian labor force
|
28,441
|
28,893
|
452
|
1.59%
|
|
Participation rate (%)
|
65.6
|
66.3
|
0.7pts.
|
1.07%
|
|
Employed
|
27,280
|
27,775
|
495
|
1.81%
|
|
Employment/population %
|
62.9
|
63.8
|
0.9pts.
|
1.43%
|
|
Unemployed
|
1,161
|
1,118
|
-43
|
-3.70%
|
|
Unemployment rate (%)
|
4.1
|
3.9
|
-0.2pts.
|
-4.88%
|
|
Not in labor force
|
14,918
|
14,669
|
-249
|
-1.67%
|
|
|
Native born, 16 years and older
|
|
Civilian population
|
213,739
|
214,975
|
1,364
|
0.64%
|
|
Civilian labor force
|
133,107
|
133,930
|
1,222
|
0.92%
|
|
Participation rate (%)
|
62.3
|
62.3
|
0.0pts.
|
0.00%
|
|
Employed
|
127,597
|
128,666
|
1,539
|
1.20%
|
|
Employment/population %
|
59.7
|
59.9
|
0.2pts.
|
0.67%
|
|
Unemployed
|
5,510
|
5,264
|
-246
|
-4.50%
|
|
Unemployment rate (%)
|
4.1
|
3.9
|
-0.2pts.
|
-4.90%
|
|
Not in labor force
|
80,632
|
81,045
|
143
|
0.18%
|
|
Source: BLS, The Employment Situation March 2019, Table A-7, April 5, 2019.
|
|
http://www.bls.gov/news.release/pdf/empsit.pdf
|
|
Over the past 12 months (March 2018 to March 2019):
- Immigrant employment rose 1.81%; native-born American employment was up 1.20%. ADVANTAGE IMMIGRANTS, though reduced from the multiples we saw earlier this year.
- The immigrant labor force (employed plus looking for work) rose 1.6%; the native-born labor force grew 0.9%— ADVANTAGE IMMIGRANTS, ATTRIBUTABLE (PERHAPS) TO THE CROSS-BORDER SURGE IN ILLEGAL ECONOMIC MIGRANTS SEEKING JOBS
- The Labor Force Participation Rate (LPR), a sign of worker confidence and mobility, rose to 66.3% for immigrants, a gain of 0.7 points, but was UNCHANGED, at 62.3%, for native-born Americans. ADVANTAGE IMMIGRANTS
- Unemployment rates for both native-born and immigrants fell to 3.9% from 4.1% the prior March, a 4.9% reduction. A TIE, although the unemployment rate decline for native-born was achieved the “wrong way”, via a stagnant LPR rather than strong growth in employment and the American labor force.
Meanwhile, an increasingly porous southern border threatens further displacement losses. It’s clear that, because of a combination of judicial sabotage, Congressional inaction, and insufficient executive action, the “Trump Effect” has evaporated and the southern border has collapsed. [Trump Vowed to Slow Border Crossings. Now They've Hit a 12-Year High, by Brian Bennet, Time, April 10, 2019]. Prudence dictates that we treat this for what it appears to be at this moment: a national emergency.
To repeat National Data’s traditional conclusion: Over the long haul, only legislation can protect American workers from displacement and wage depression. Trump lost his best chance to legislate patriotic immigration reform when the GOP lost the House. But he can still use the GOP Senate majority to “begin the conversation.” He should demand an immigration moratorium.
Edwin S. Rubenstein (email him) is President of ESR Research Economic Consultants