See, earlier: Not Looking Good—Trump Attacks Coulter, Congressional GOP Cucking On Immigration
Clunk. Clunk. You heard it right. This is the sound made by the February jobs report—almost a crash landing. The meager payroll survey bump, up by just 20,000 jobs, blindsided the Main Stream Media talking heads. Was it a slowing economy? A shortage of available workers? A fluke?
“This is a disappointing report,” Carl Tannenbaum, chief economist of Northern Trust in Chicago, is quoted as saying. “I don’t think there’s any way to sugarcoat it. It’s a signal we need to be cautious with the U.S. economic outlook.” [The Jobs Report Was the Weakest in Months. Here’s Why, by Patricia Cohen, NYT, March 8, 2019]
Of course, President Trump finds this another “not to worry” moment, tweeting a quote from Fox News's Stuart Varney: “This is as good a time as I can remember to be an American Worker. We have the strongest economy in the world.”
Hmm. Trump is half right. We do have the strongest economy in the world. But native-born Americans are not the beneficiaries—not in February anyway.
The Household Survey is our sole source of job data by immigration status of workers. The February survey found 255,000 jobs were created, 12.8-times the anemic job growth reported in the Payroll Survey. Our analysis of the February survey finds that immigrants gained jobs bigtime, while Native-born Americans lost them.
In February:
- Immigrant employment rose by 269,000—up 1.0%
- Native-Born American employment fell 14,000—down by 0.01%
- The immigrant employment index, set at 100.0 in January 2009, rose to 129.1 from 127.9 in January.
- The Native-Born American employment index fell to 107.0 from 107.4 in January.
- The New VDARE American Worker Displacement Index (NVDAWDI), our name for the ratio of immigrant to native-born employment growth indexes, rose to 120.7 in December – the second highest displacement level of the 122 months since January 2009. The all-time displacement high, 123.0, was set in April 2018 – an anomalous reading, we believe. (See the spike in the NEW VDAWDI graphic below.)
Native-born American workers lost ground to their foreign-born competitors throughout the Obama years; this trend accelerated significantly in the months leading up to the 2016 election. More than half way through his first term, President Trump is still very far from breaking this trend:
![appears]()
Since taking office in January 2017, he has presided over a labor market in which immigrants gained 1.97 million jobs, a 7.6% increase, while native-born Americans gained 2.9 million, a rise of 2.3%.
As far as the jobs are concerned, “America First” has not translated into Americans First.
Another way of looking at American worker displacement: the immigrant share of total U.S. employment.
![]()
Immigrants held 17.81% of all jobs in February, up from 17.67% in January. February’s immigrant share ranks second among the 122 months for which we have data, second only to the April 2018 spike that hovers over the far right of the graphic. (The New VDARE American Worker Displacement Index (NVDAWDI) and the Immigrant Share of U.S. Employment move in tandem)
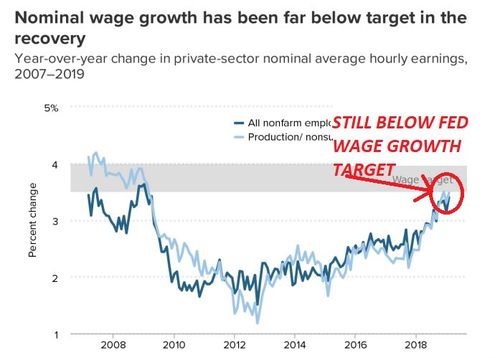
There were some positive developments in the latest report. Paychecks are growing. Private sector average hourly wages climbed 3.4% in February from February 2018. Not since the end of the Great Recession a decade ago have wages risen like this.
However, as brought out in the EPI graphic below, these annual hikes in nominal (not inflation-adjusted) wage growth, although returning to pre-Great Recession levels, is still below the Federal Reserve’s target for non-inflationary wage growth:
![]()
Source: Economic Policy Institute Nominal Wage Tracker
Looked at cumulatively (we’ll be posting a chart on this soon) the amazing fact is that, for many Americans, wages have not exceeded the levels reached 20-30 years ago. (See table A-2 [Excel]).
EPI and National Data agree: wage growth is now recovering—but not as good as it should be.
We humbly suggest that immigration may be the reason. Even larger wage gains would have transpired had the immigrant share of employment not increased. Economist George Borjas estimates that every 10 percentage-point increase in the foreign-born share of employment reduces native-born Americans’ wages by 3% to 4%. [Immigration and the American Worker, by George Borjas, CIS.org, April 9, 2013, and Yes, Immigration Hurts American Workers , Politico, October 2016]
Since February 2009, the foreign-born employment share has risen by about 2.8 percentage points—implying that wages would be about one percentage point higher than they are today had an immigration moratorium been in effect since then—or almost a 33% increase in wage growth.
Meanwhile, an increasingly porous southern border threatens further displacement losses. Last month the Border Patrol apprehended more than 76,103 migrants, more than twice the number they nabbed last February, and the most for February in 12 years.
![]()
This is becoming a disaster. Recent Border Patrol apprehensions are now running generally higher than during the Obama years.
The system is overwhelmed: Not enough detention facilities, not enough immigration judges, and not enough determination to protect the economic and physical well-being of native-born Americans.
We expect Border Patrol apprehensions will continue to rise, while an even larger number may avoid detection and enter successfully.
Only a border wall can make things right.
A month ago we reported that the immigrant population of working age (16 years plus, legal and illegal) increased by 284,000 from the prior January. The comparable figure for February is 500,000– nearly twice the January figure.
Both figures are well below the 1.439 million year-over-year gain recorded in December 2018, the fifth consecutive month of 1 million+ year-over-year growth that year. But the 2019 data reflect new Census Bureau population estimates for the Household Survey, and are not comparable to earlier years.
And this near-doubling from January to February of this 2019 is troubling. It may reflect increased demand for cheap foreign workers by U.S. employers, many of whom still claim—fraudulently we believe—they face a labor shortage.
It’s sobering to remember that as recently as the last five months of 2017 the immigrant working age population actually shrank. Back then the now-vanished “Trump Effect” seemed to be really taking hold. Now it has evaporated.
A detailed snapshot of American worker displacement over the past year is available in the Employment Status of the Civilian Population by Nativity table published in the monthly BLS Report:
![]()
Over the past 12 months (February 2018 to February 2019):
- Immigrant employment rose 2.67%; native-born American employment was up 0.82%. ADVANTAGE IMMIGRANTS, though reduced from the multiples we saw earlier this year.
- The immigrant labor force (employed plus looking for work) rose 2.39%; the native-born labor force grew 0.47%—A HORRIFIC 5.1-FOLD GROWTH ADVANTAGE FOR IMMIGRANTS, ATTRIBUTABLE (PERHAPS) TO A CROSS-BORDER SURGE IN ILLEGAL MIGRANTS SEEKING JOBS
- The Labor Force Participation Rate (LPR), a sign of worker confidence and mobility, rose to 64.0% for immigrants, a gain of 0.8 points; the LPR for natives was UNCHANGED, at 62.3%, for native-born. ADVANTAGE IMMIGRANTS
- The immigrant unemployment rate fell to 3.7%, down 7.5% from last year; the native-born unemployment rate fell to 4.1%, an 8.9% drop over that period. A win for native-born Americans–although their stagnant Labor Force Participation rate diminishes the magnitude of the apparent victory.
- The number of native-born unemployed fell by 416,000, a 6.97% drop; immigrant unemployment fell by 49,000, a 4.4% decline. ADVANTAGE NATIVE-BORN AMERICANS
Over the long haul, only legislation can protect American workers from displacement and wage depression. Tragically, the Trump Administration appears, contrary to its campaign promises, to be headed in exactly the opposite direction.
Trump lost his best chance to legislate patriotic immigration reform when the GOP lost the House. But he can still use the GOP Senate majority to “begin the conversation.”
He should demand an immigration moratorium.
Edwin S. Rubenstein (email him) is President of ESR Research Economic Consultants