See also A Long Farewell To Donald Trump, Immigration Patriot. And Thanks.
To the surprise of some observers, Donald Trump didn’t bring up immigration much in the election campaign. Which was really inexplicable because, although he’s passed no legislation, the area has emerged as a quiet Trump triumph, as the October jobs data just confirmed.
The U.S. created 638,000 payroll jobs in October, and the unemployment rate fell to 6.9%, the lowest level of the pandemic. (The overall job gain would have been even larger without the loss of 147,000 temporary census positions.)
This was far better than economists had projected.
But the really BIG news was the “other” employment survey, of Households rather than businesses. It reported a whopping 2.243 million jobs added last month.
In October:
- Total employment rose by 2.243 million, a 1.52% gain from September.
- Immigrants (legal and illegal, the federal government does not distinguish) gained 381,000 jobs, up 1.56% from September.
- Native-born Americans gained 1.862 million jobs, up 1.51% from September.
- VDARE.com’s immigrant employment index, set at 100.0 in January 2009, rose to 114.4 from 112.6 in September, a 1.56% gain.
- The native-born American employment index rose to 103.7 from 102.2 in September, in a gain of 1.51%. At 103.7, the October index indicates that 3.7% more native-born American workers held jobs last month than in January 2009, Obama’s first year in office.
This means that American worker displacement rose, but imperceptibly. The New VDARE American Worker Displacement Index (NVDAWDI), our name for the ratio of immigrant to native-born American employment growth indexes since Jan. 2009, rose to 110.3 in October from 110.2 in September.
Overall, not since May 2016 has VDARE.com’s Displacement Index been this low in normal—i.e., non-pandemic—times.
Displacement is, of course, a relative term. It measures immigrant job growth relative to that of American native-born workers. Thanks, in part, to Trump’s (relatively) hard line on immigration, expressed basically via administrative measures, the Trump years saw a labor market where native-born Americans first held the line and then, in the COVID contraction, lost relatively fewer jobs than immigrants.
This is not quite what Trump supporters had in mind in November 2016. But it’s certainly something.
As far as employment levels are concerned, both groups are doing poorly right now because of the pandemic: from the start of the Trump Administration (January 2017) through October 2020, native-born Americans lost 1.050 million jobs, a 0.832% decline, while immigrants lost 1.225 million, a 4.7% reduction.
But the percentage job losses suffered by native-born American workers during Trump’s tenure are significantly less than those endured by immigrants. So if native-born voters were to evaluate the Trump economy solely on how they’re doing relative to immigrants, it would be a positive judgment.
Similarly, if voters had focused solely on the direction of the economy in October, things look quite good. That 661,000 payroll survey job gain represents stronger job growth than in all but a handful of months in the modern record. Outside of this summer’s remarkable rebound (4.8 million jobs added in June alone), you have to go back to the 1940s and 1950s to find months of comparable improvement [Strong Job Growth, a Terrible Job Market: The Bizarre 2020 Economy, by Neil Irwin, NY Times, October 2, 2020]
Another way of measuring displacement: the immigrant share of total employment.
Our analysis of the October report shows the immigrant share of total employment rose slightly, to 16.53%, down from 16.52% in September. After some gyrations, it had been falling steadily before the pandemic started. In February 2020 immigrants held 17.53% of all jobs.
Each 1% decline in immigrant employment share represents a transfer of about 1.4 million jobs from immigrants to native-born workers.
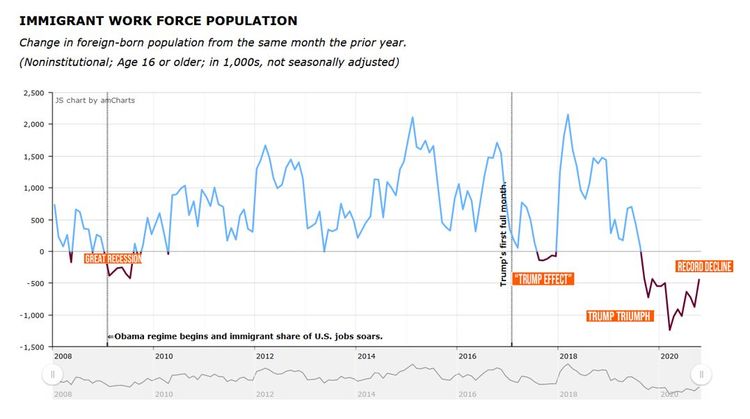
More good news for immigration patriots: October saw another decline in the foreign-born working-age population, year over year. It fell by 435,000 from last October—the 14th straight month of year-over-year decline, the most dramatic contraction for many years.
The exit of adult immigrants slowed last month—shown on our chart as an uptick in the red line—but it’s still solidly in negative territory. In September, this population fell by 875,000 from the same month of last year.
For comparison, the average monthly decline in immigrant workers in recent months is more than double what we saw in the 2008 Great Recession. Back then, immigrants were leaving at the rate of 300,000 to 400,000 a month, year-over-year. And the current decline far exceeds the “Trump Effect” seen in the early months of the administration, when illegals apparently self-deported out of fear.
This decline was underway well before the pandemic hit. It has to be counted as a significant Trump achievement—a “Trump Triumph” as we labelled it on our featured charts.
By further flushing out immigrants, COVID-19 seems to have accentuated an America-First trend already underway for some time. But the expanding economy may be about to suck immigrants back in—illegal immigration is already rising on the southern border. That’s why unemployed Americans needed protecting by the institutionalization of President Trump’s administrative immigration moratorium.
But that presumably won’t happen in a Biden Administration. America First legislators need to be on the alert.
A more detailed picture of how American workers have fared vis-à-vis immigrants is published in Table A-7 of the monthly BLS Report:
|
Employment Status by Nativity, Oct.2019-Oct.2020
|
|
(numbers in 1000s; not seasonally adjusted)
|
|
|
Oct-19
|
Oct-20
|
Change
|
% Change
|
|
|
Foreign born, 16 years and older
|
|
Civilian population
|
42,326
|
41,891
|
-435
|
-1.03%
|
|
Civilian labor force
|
28,067
|
26,919
|
-1,148
|
-4.09%
|
|
Participation rate (%)
|
66.3
|
64.3
|
-2.0
|
-3.02%
|
|
Employed
|
27,346
|
24,865
|
-2,481
|
-9.07%
|
|
Employment/population (%)
|
64.6
|
59.4
|
-5.2
|
-8.05%
|
|
Unemployed
|
722
|
2,055
|
1,333
|
184.63%
|
|
Unemployment rate (%)
|
2.6
|
7.6
|
5.0
|
192.31%
|
|
Not in labor force
|
14,258
|
14,971
|
713
|
5.00%
|
|
|
Native born, 16 years and older
|
|
Civilian population
|
217,519
|
219,034
|
1,515
|
0.70%
|
|
Civilian labor force
|
136,509
|
134,134
|
-2,375
|
-1.74%
|
|
Participation rate (%)
|
62.8
|
61.2
|
-1.6
|
-2.55%
|
|
Employed
|
131,721
|
125,569
|
-6,152
|
-4.67%
|
|
Employment/population (%)
|
60.6
|
57.3
|
-3.3
|
-5.45%
|
|
Unemployed
|
4,788
|
8,565
|
3,777
|
78.88%
|
|
Unemployment rate (%)
|
3.5
|
6.4
|
2.9
|
82.86%
|
|
Not in labor force
|
81,010
|
84,901
|
3,891
|
4.80%
|
|
Source: BLS, The Employment Situation—October 2020. Table A-7, November 6, 2020. PDF
|
| |
|
|
|
|
|
|
From October 2019 to October 2020:
- The native-born American working-age population rose by 1.515 million, a gain of 0.70%; the corresponding immigrant population fell by 435,000—a 1.03% decline. This October was the 14th consecutive month in which the working age immigrant population declined, year-over-year.
- Both native-born and immigrants suffered large job losses, year-over-year; native-born lost 6.2 million positions, a 4.7% decline, while foreign-born workers were hit harder, losing 2.5 million jobs, a 9.1% loss. Both groups did relatively better in October than in September, i.e., their percentage job losses (from the same month last year) were lower.
- The immigrant labor force (working or looking for work) fell by 1.148 million, or 4.09%; the native-born labor force fell by 2.38 million, a 1.74% drop. Advantage native-born Americans.
- Unemployment rates for native-born Americans rose 82.9% year-over-year, from 3.5% last October to 6.4% in October 2020; over that period the immigrant unemployment rate rose 192.3%, from 2.6% to 7.6%. Advantage native-born Americans.
- 8.6 million native-born and 2.1 million immigrants were unemployed in October, but since October of last year the number of unemployed immigrants rose by 184.6%, while the number of native-born jobless rose by “only” 78.9%. Advantage native-born Americans.
- Labor force Participation Rates declined for both immigrants and native-born Americans, with the immigrant LPR falling by 2.0 percentage points, or by 3.0%, and the native-born American rate down by 1.6 percentage points, or 2.6%. Advantage Native-born Americans.
Immigrant workers have lost ground relative to native-born over the past 12 months. Last October the unemployment rate for foreign-born workers was below that of native-born, 2.6% versus 3.5%. This October the positions were reversed, with native-born unemployment at 6.4% and the immigrant rate at 7.6%.
Similarly, the 12-month move in Labor Force Participation rates, which rise or fall as confidence that jobs are available rise and falls, bodes well for native-born workers. While the immigrant LPR in October 2020 is still above that of native-born, the gap narrowed over the last year.
Trump had a great opportunity: He could have locked in the recovery’s benefits for the American worker—and stemmed recent immigration’s damage to the GOP—if he had acted on his instincts and campaigned on extending his temporary immigration moratorium.
But Trump missed the chance to make this point. Now Biden may throw everything away.
Edwin S. Rubenstein (email him) is President of ESR Research Economic Consultants