Donald Trump didn’t bring up immigration in his Tuesday debate with Joe Biden and that’s really inexplicable, because although he’s passed no legislation the area has emerged as a quiet triumph.
The U.S. created 661,000 payroll jobs in September, and the unemployment rate fell to 7.9%, the lowest level of the pandemic. This is the last monthly jobs report—and one of the last major economic data releases—before the presidential election.
Private sector hiring was relatively strong, with 877,000 new jobs created. What dragged job creation down in September was a decline in public education jobs at schools and local colleges. Most have adopted on-line learning, in part because many teachers are unwilling to enter classrooms due to health concerns.
The “other” employment survey, of Households rather than businesses, reports only 275,000 jobs were added last month. But the good news: our analysis of the September survey finds native-born workers came out ahead, while immigrants lost jobs.
In September:
- Immigrants lost 181,000 jobs, a 0.74% reduction from August.
- Native-born Americans gained 456,000 jobs, up 0.27% from August.
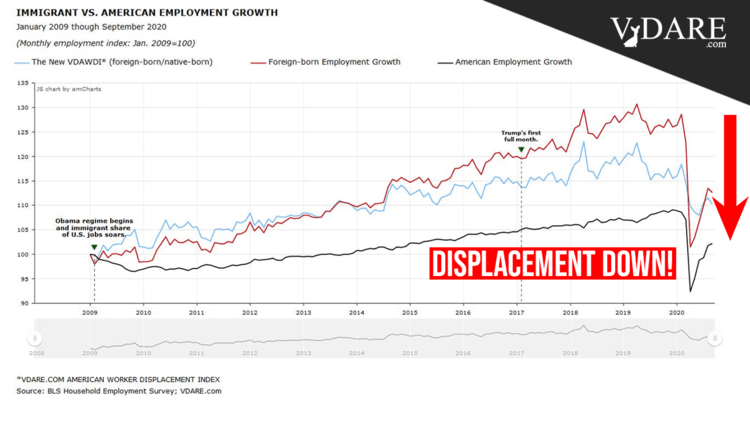
- VDARE.com’s immigrant employment index, set at 100.0 in January 2009, fell to 112.6 from 113.5 in August, a 6.2% reduction.
- The native-born American employment index rose to 102.2 from 101.8 in August, in a gain of 0.4%. At 102.2, the September index indicates that 2.2% more native-born American workers held jobs last month than in January 2009, Obama’s first year in office.
Accordingly, the New VDARE American Worker Displacement Index (NVDAWDI), our name for the ratio of immigrant to native-born American employment growth indexes since Jan. 2009, fell—to 110.2 in September from 110.6 in August.
Not since May 2016 has VDARE.com’s Displacement Index been this low in normal—i.e., non-pandemic—times.
Displacement is, of course, a relative term. It measures immigrant job growth relative to that of native-born workers. Thanks, in part, to Trump’s (relatively) hard line on immigration, expressed basically via administrative measures, the Trump years saw a labor market where native-born Americans lost relatively fewer jobs than immigrants.
This is not quite what Trump supporters had in mind in November 2016. But it’s something.
As far as employment levels are concerned, both groups are doing poorly right now because of the related pandemic: From the start of the Trump Administration (January 2017) through September 2020, native-born Americans lost 2.9 million jobs, a 2.3% decline, while immigrants lost 1.6 million, a 6.2% reduction.
But the percentage job losses suffered by native-born American workers during Trump’s tenure are significantly less than those endured by immigrants. So if native-born voters were to evaluate the Trump economy solely on how they’re doing relative to immigrants, it would be a positive judgment.
Similarly, if voters were to focus on the direction of the economy in September, things look quite good. That 661,000 payroll survey job gain represents stronger job growth than in all but a handful of months in the modern record. Outside of this summer’s remarkable rebound (4.8 million jobs added in June alone) to find months of comparable improvement you have to go back to the 1940s and 1950s [Strong Job Growth, a Terrible Job Market: The Bizarre 2020 Economy, by Neil Irwin, NY Times, October 2, 2020]
Another way of measuring displacement: the immigrant share of total employment. Our analysis of the September report shows the immigrant share of total employment fell to 16.52%, down from 16.68% in August. It had been falling steadily before the pandemic started. In February 2020 immigrants held 17.53% of all jobs.
Each 1% decline in immigrant employment share represents a transfer of about 1.4 million jobs from immigrants to native-born workers.
More good news for immigration patriots: September saw another decline in the foreign-born working-age population, year over year. It fell by 875,000 from September 2019—the 13th straight month of year-over-year decline. Moreover, the exit of adult immigrants seems to be accelerating—it shrank by 723,000 in August, and 636,000 in July, year-over-year.
This current immigrant workforce decline is more than double that seen in the 2008 Great Recession. Back then immigrants were leaving at the rate of 300,000 to 400,000 a month, year-over-year. And it for exceeds the “Trump Effect” seen in the early months of the administration, when illegals apparently self-deported out of fear.
This decline was underway well before the pandemic hit. It has to be counted as a significant Trump achievement—a “Trump Triumph” as we have labelled it on our featured charts.
By further flushing out immigrants, COVID-19 seems to have accentuated an America-First trend already underway for some time—but it’s possible that immigrants may be about to return. Unemployed Americans need protecting by the institutionalization of President Trump’s administrative immigration moratorium.
A more detailed picture of how American workers have fared vis-à-vis immigrants is published in Table A-7 of the monthly BLS Report:
|
|
Employment Status by Nativity, Sept.2019-Sept.2020
|
|
(numbers in 1000s; not seasonally adjusted)
|
|
|
Sep-19
|
Sep-20
|
Change
|
% Change
|
|
|
Foreign born, 16 years and older
|
|
Civilian population
|
42,685
|
41,810
|
-875
|
-2.05%
|
|
Civilian labor force
|
28,121
|
26,712
|
-1,409
|
-5.01%
|
|
Participation rate (%)
|
65.9
|
63.9
|
-2.0pts.
|
-3.03%
|
|
Employed
|
27,392
|
24,419
|
-2,973
|
-10.85%
|
|
Employment/population (%)
|
64.2
|
58.4
|
-5.8pts.
|
-9.03%
|
|
Unemployed
|
729
|
2,293
|
1,564
|
214.54%
|
|
Unemployment rate (%)
|
2.6
|
8.6
|
6.0pts.
|
230.77%
|
|
Not in labor force
|
14,563
|
15,098
|
535
|
3.67%
|
|
|
Native born, 16 years and older
|
|
Civilian population
|
216,953
|
218,933
|
1,980
|
0.91%
|
|
Civilian labor force
|
135,822
|
133,361
|
-2,461
|
-1.81%
|
|
Participation rate (%)
|
62.6
|
60.9
|
-1.7pts.
|
-2.72%
|
|
Employed
|
131,086
|
123,377
|
-7,709
|
-5.88%
|
|
Employment/population (%)
|
60.4
|
56.4
|
-4.0pts.
|
-6.62%
|
|
Unemployed
|
4,736
|
9,983
|
5,247
|
110.79%
|
|
Unemployment rate (%)
|
3.5
|
7.5
|
4.0pts.
|
114.29%
|
|
Not in labor force
|
81,131
|
85,572
|
4,441
|
5.47%
|
|
Source: BLS, The Employment Situation, September 2020. Table A-7, October 2, 2020. PDF
|
|
|
|
From September 2019 to September 2020:
The native-born American working-age population rose by 1.980 million, a gain of 0.91%; the corresponding immigrant population fell by 875,000—a 2.05% decline. September 2020 was the 13th consecutive month in which the working age immigrant population declined, year-over-year. The September decline exceeded those for July and August—indicating that the exodus of working age immigrants is accelerating.
- Both native-born and immigrants suffered large job losses year-over-year; native-born lost 7.71 million positions, an 5.9% reduction; foreign-born workers were hit harder, losing 2.97 million jobs, a 10.9% loss. Both groups did better in September 2020 than in June 2020, i.e., their percentage job losses were significantly lower, year-over-year. While some may see this as “good news,” it is also evidence that an IMMIGRATION MORATORIUM is needed to preserve job gains for native-born workers.
- The immigrant labor force (working or looking for work) fell by 1.409 million, or 5.01%; the native-born labor force fell by 2.46 million, a 1.8% drop. Advantage native-born Americans.
- Unemployment rates for native-born Americans rose 114.3% year-over-year, from 3.5% last September to 7.5% in September 2020; over that period the immigrant unemployment rate rose 231%, from 2.6% to 8.6%. Advantage native-born Americans.
- 10 million native-born and 2.3 million immigrants were unemployed in September, but since September of last year the number of unemployed immigrants rose by 215%, while the number of native-born jobless rose by “only” 111%. Advantage native-born Americans.
- Labor force Participation Rates declined for both immigrants and native-born Americans, with the immigrant LPR falling by 2.0 percentage points, or by 3.0%, and the native-born American rate down by 1.7 percentage points, or 2.7%. Why are participation rates falling at a time when unemployed workers have not received Federal unemployment benefits for two months? In theory, unemployment benefits discourage job search, so LPRs should be rising now. One possible explanation: a large underground economy, not reflected in government statistics, is employing millions of workers.
In normal times about 300,000 working-age immigrants leave the country voluntarily. With immigrant job loses high in the pandemic, this number is undoubtedly larger today—but as economic recovery takes hold, they will try to return.
This presents Donald Trump with a great opportunity: He can lock in the recovery’s benefits for the American worker—and stem recent immigration’s damage to the GOP—if he acts on his instincts and imposes an immigration moratorium.
Trump’s handlers missed the chance to make this point during the convention. And his debate prep apparently botched it also.
Hopefully, a Trump recovered will revisit his primal instincts in the last weeks of the campaign.
Edwin S. Rubenstein (email him) is President of ESR Research Economic Consultants