[Research by Edwin S. Rubenstein]
The Biden Rush on the U.S. Southern Border is now so bad that even the useless Republican National Committee chairthing Ronna McDaniel has felt emboldened to mention it:
Which is progress. At least McDaniel isn’t repeating the “Family values don’t stop at the Rio Grande” complacency about the illegal influx that typified the brain-dead Bush Blight.
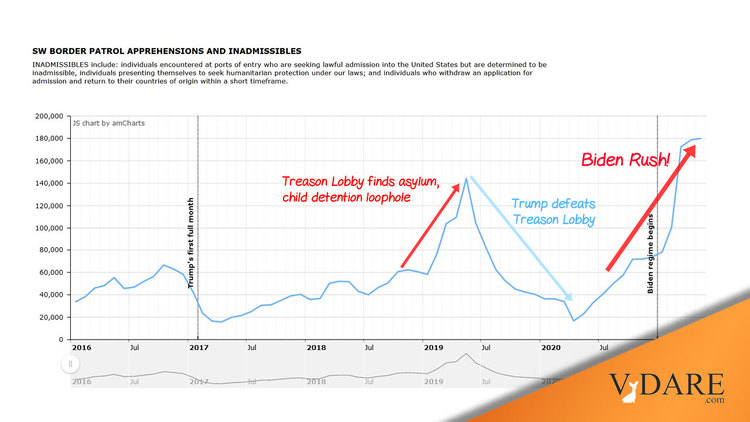
Just-released CBP data shows that border apprehensions continued to increase in May, [Illegal border crossing attempts reach new high under Biden: 180,000 in May, by Anna Giaritelli, Yahoo News, June 9, 2021]
Even the Biden Regime knows that this means trouble. It is attempting to blame Vice President Kamala Harris [White House officials are 'quietly perplexed' by Kamala Harris' comments on not yet visiting the border and fear they may overshadow her first foreign trip as VP, report says, by Ashley Collman, Business Insider, June 10, 2021]. She apparently doesn’t want to be blamed.
And Biden’s media mouthpieces are also shamelessly attempting to downplay the surge because more illegals are simply going to Ports Of Entry and attempting to use the “asylum” loophole under Biden’s relaxed rules [Border Patrol records first drop in migrant encounters at U.S. border in more than a year, by Rafael Carranza, Arizona Republic, June 9, 2021].
Of course, this is still just another aspect of the “Biden Rush” provoked by the Administration’s determination to Elect A New People.
But, somewhat to our surprise, the full impact of this border collapse has not still yet been felt in this unusually confused labor market, as started to happen in January.
Last month’s recently released jobs data showed the U.S. economy added 559,000 jobs in May, about twice the previous month’s gain although less than the 617,000 Wall Street consensus. The jobless rate fell to 5.8%, aided in part by a small reduction in the U.S. labor force. Many economists blame the Labor Force decline on overly generous unemployment benefits.
The “other” employment survey,” of Households rather than businesses, shows a 444,000 gain for May. The Household Survey reports immigrant status. By our calculations, May marked another month during which native-born Americans slowly gained jobs while immigrants (legal and illegal, the federal government data does not distinguish) lost them.
In May:
- Immigrants (legal and illegal) lost 44,000 jobs, a 0.17% decline from April.
- Native-born Americans gained 488,000 positions, a 0.39% rise from April.
- Thus VDARE.com’s immigrant employment index, set at 100.0 in January 2009, fell to 119.0 in May from 119.2 in April, a 0.17% reduction.
- VDARE.com’s Native-Born employment index rose to 104.4 from 104.0 in April, a 0.39% increase.
This means that the New VDARE American Worker Displacement Index (NVDAWDI), our name for the ratio of immigrant to native-born employment growth indexes since Jan. 2009, fell to 114.0 in May from 114.7 in April, a 0.56% decline.
Note that this means American Worker Displacement is now slightly lower level than it was when Donald Trump was inaugurated in January 2017. After wild gyrations during his Administration, it finally fell, partly because of the pandemic and partly because of his Executive Actions. But then it bounced back.
The relative ease with which native-born American workers can access unemployment benefits should, other things equal, have increased their displacement by immigrants. But that doesn’t seem to have happened—yet.
One thing is certain: millions of people who had jobs before the pandemic aren’t even looking for jobs now. Total employment in May was 7.6 million below the pre-pandemic high reached in February 2020.
Significantly, however, despite increased immigrant unemployment, the year-over-year rise in the foreign-born working-age population continued, albeit at a lower rate, last month.
Note carefully what this chart shows. Unlike our other charts, which show absolute values, this one compares each month to the same month of the prior year. So the immigrant workforce population grew by 373,000 in May 2021 compared to May 2020. The corresponding increases for March and April were 736,000 and 542,000, respectively.
Note that, for most of 2020, the population of working-age immigrants actually declined year-over-year. This exodus far exceeded the net exodus during the 2008 Great Recession, and the brief net exodus during Trump’s first year, when his mere presence seems to have jawboned illegals into fleeing.
The Immigrant Work Force population started growing again only in December 2020—when the election results spurred a renewed invasion. But again, its full effect on displacement and wage rates has yet to be felt.
Another displacement metric—the immigrant share of total employment—also fell, very slightly, in May, although still remaining considerably above its lowest point in the Trump Administration.
Our analysis shows 16.99% of May jobs were held by immigrants—below April’s 17.07% and March’s 17.20%. In May 2020 immigrants held 16.32% of jobs.
Note that, after some gyrations, the immigrant share of employment had been falling steadily even before the pandemic started. But, again, the Trump gains have been wiped out. It is hard to believe that the immigrant share will not soon resume its Obama-Era upward march.
A more detailed picture of how American workers have fared vis-à-vis immigrants is published in Table A-7 of the monthly BLS Report:
|
|
Employment Status by Nativity, May 2020-May 2021
|
|
|
(numbers in 1000s; not seasonally adjusted)
|
|
|
|
Apr-20
|
Apr-21
|
Change
|
% Change
|
|
|
|
Foreign born, 16 years and older
|
|
|
Civilian population
|
42,496
|
42,869
|
373
|
0.88%
|
|
|
Civilian labor force
|
26,622
|
27,327
|
705
|
2.65%
|
|
|
Participation rate (%)
|
62.6
|
63.7
|
1.1%pts.
|
1.76%
|
|
|
Employed
|
22,434
|
25,789
|
3,355
|
14.95%
|
|
|
Employment/population (%)
|
52.8
|
60.2
|
7.4% pts.
|
14.02%
|
|
|
Unemployed
|
4,188
|
1,537
|
-2,651
|
-63.30%
|
|
|
Unemployment rate (%)
|
15.7
|
5.6
|
10.1%pts.
|
-64.33%
|
|
|
Not in labor force
|
15,874
|
15,542
|
-332
|
-2.09%
|
|
|
|
Native born, 16 years and older
|
|
|
Civilian population
|
217,551
|
218,341
|
790
|
0.36%
|
|
|
Civilian labor force
|
131,353
|
133,280
|
1,927
|
1.47%
|
|
|
Participation rate (%)
|
60.4
|
61.0
|
0.6% pts.
|
0.99%
|
|
|
Employed
|
115,027
|
125,989
|
10,962
|
9.53%
|
|
|
Employment/population (%)
|
52.9
|
57.7
|
4.8% pts.
|
9.07%
|
|
|
Unemployed
|
16,326
|
7,291
|
-9,035
|
-55.34%
|
|
|
Unemployment rate (%)
|
12.4
|
5.5
|
-6.9% pts.
|
-55.65%
|
|
|
Not in labor force
|
86,198
|
85,061
|
-1,137
|
-1.32%
|
|
|
Source: BLS, The Employment Situation, May 2021. Table A-7, June 4, 2021.
|
|
|
http://www.bls.gov/news.release/pdf/empsit.pdf
|
From MAY 2020 to MAY 2021:
- The immigrant working age population rose by 373,000, a gain of 0.88%; the native-born American population rose by 790,000—a rise of 0.36% over that period. ADVANTAGE IMMIGRANTS, AS THEIR POPULATION OF WORKING AGE GREW MORE THAN 2.0 TIMES FASTER THAN THAT OF NATIVE-BORN AMERICANS.
- Immigrants gained 3.4 million jobs—a 15% gain; native-born American workers gained 11 million, a gain of 9.5% over this period. ADVANTAGE IMMIGRANTS
- The immigrant civilian labor force (working or looking for work) rose by 705,000, or 2.65%; the native-born American labor force rose by 1.9 million, or 1.47%. ADVANTAGE IMMIGRANTS
- The unemployment rate for native-born Americans fell from 12.4% to 5.5%, a 55.7% reduction; the immigrant unemployment rate fell from 15.7% to 5.6%—a 64.3% reduction. ADVANTAGE NATIVE-BORN, THOUGH UNEMPLOYMENT RATES FOR BOTH ARE WELL ABOVE PRE-PANDEMIC LEVELS.
- 7.3 million native-born Americans, and 1.5 million immigrants, were unemployed in May; over the past 12 months the number of unemployed immigrants fell by 63.3%, while native-born American jobless declined by 55.3%. ADVANTAGE IMMIGRANTS
- Labor Force Participation Rates (LPR) rose for both immigrants and native-born workers. However, the rise in LPR for native-born Americans over the past 12 months—0.99%—is considerably below that of immigrants: 1.76%. This may reflect work disincentives of unemployment insurance and other social safety-net programs that, in most of the country, are more easily obtained by native-born Americans than immigrants. ADVANTAGE IMMIGRANTS
We find ourselves in agreement with the New York Times:
“We can’t dismiss anything at this point because there’s no precedent for any of this,” says Ian Shepherdson, chief economist at Pantheon Macroeconomics, a forecasting firm [The U.S. Economy Is Sending Confusing Signals. What’s Going On? by Ben Casselman, June 3, 2021].
But the Biden Rush is real. And this immigrant surge is a Sword Of Damocles hanging over the head of American workers.
Peter Brimelow [Email him] is the editor of VDARE.com. His best-selling book, Alien Nation: Common Sense About America’s Immigration Disaster, is now available in Kindle format.