[Research by Edwin S. Rubenstein]
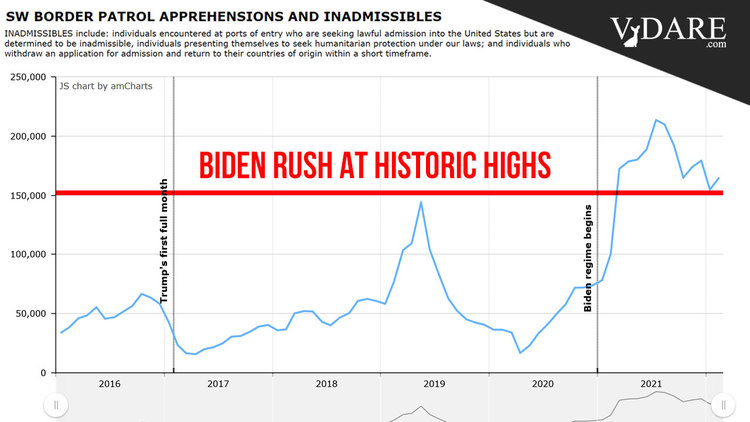
The Biden Rush continues—apprehensions at the southwest border, a proxy for total crossings, tower above anything seen in recent history. This is particularly ominous because immigrant displacement of American workers, which will ultimately be impacted by this influx, also continues at historic highs. And—a new factor since we began following American Worker Displacement in 2004—surging inflation means that American workers face sharply reduced wages in inflation-adjusted terms. All this, it must be said, is in dramatic contrast to the “blue collar boom” that occurred under Donald J. Trump’s presidency. At the very least, the Biden Regime is taking a wild political risk with working-class living standards.
Apprehensions ticked up again on the southwest border in February and were unprecedented in recent history:
Disquieting features of last month’s influx: a sharp increase in single adult Mexicans and in the number of minor children traveling without parents [Mexicans surged as illegal immigration on border rose in February, by Stephen Dinan, Washington Times, March 20, 2022].
To Regime supporters, who never pay any attention to the immigration dimension, last month’s jobs data was good: the New York Times cited “plentiful jobs and quickly rising wages” [Surging U.S. Inflation Raises Stakes as War Pushes Up Prices, by Jeanna Smialek, NYT, March 10, 2022].
The economy added back the most jobs since July 2021 last month, as an already tight labor market gobbled up 678,000 additional workers, according to the widely cited Payroll Survey. The unemployment rate fell to 3.8%, the lowest level since the pandemic hobbled the U.S. economy. All this came despite a pop in the labor force participation rate, to 62.3%, signaling that more people were returning to the workforce… and finding jobs.
Our analysis of the February Household Survey indicates an employment gain of 548,000—about 25% less than growth reported in the Payroll Survey.
As far as total employment is concerned, Household Survey figures are invariably above Payroll Figures. The employment “gap” between the two in February was 7.3 million, or 4.6%, in favor of the Household Survey. Our explanation: U.S. businesses are reluctant to acknowledge illegals working “off the books.” This illicit workforce is counted in the Household Employment Survey, but not on the Payroll Employment Survey.
February job growth by nativity, aka native born vs. American immigrant status, calculated exclusively by VDARE.com from Household Survey data:
- Immigrants (legal and illegal) gained 19,000 jobs, a 0.07% increase from January.
- Native-born Americans gained 529,000 positions, a 0.41% rise from January.
- Thus VDARE.com’s immigrant employment index, set at 100.0 in January 2009, rose to 130.6 in February from 130.5 in January, a 0.07% increase.
- VDARE.com’s native-born employment index rose to 107.4 from 106.9 in January, a gain of 0.41%.
The New VDARE American Worker Displacement Index (NVDAWDI), our name for the ratio of the immigrant to native-born employment growth indexes since January 2009, fell to 121.7 from 122.1 in January, a 0.34% decline.
Despite 1.092 million immigrants reported as unemployed in February, the foreign-born working-age population expanded by more than 1 million, year-over-year, for the sixth straight month:
Note carefully what this chart shows. Unlike our other charts, which show absolute values, this one compares each month to the same month of the prior year. So the immigrant workforce population grew by 1.345 million in February 2022 compared to February 2021. The corresponding increases for January and December were 1.538 million and 1.225 million, respectively.
For most of 2020, the population of working-age immigrants declined on net year-over-year. This far exceeded the net exodus during the 2008 Great Recession, and the brief net exodus during Trump’s first year, when his mere presence seemed to have jawboned illegals into fleeing.
The immigrant Work Force population started growing again only in December 2020—when the election results spurred a renewed invasion.
Another displacement metric—the immigrant share of total employment—fell slightly last month, but still remains close to the record touched in April 2018.
Our analysis shows that 17.929% of jobs were held by immigrants in February. In April 2018, the immigrant share spiked to 18.083%—a one-month anomaly attributable to the random noise that affects all economic data at one time or another, although arguably within the long-run trend.
Note that, after some gyrations, the immigrant share of employment had been falling steadily even before the pandemic started. But, again, the Trump gains have been wiped out and the immigrant share is resuming its Obama-Era upward march.
Each 1% rise in immigrant employment share represents a transfer of about 1.5 million jobs from native-born Americans to immigrants.
We are told incessantly that the labor market is strong, that the demand for labor is far greater than the supply. If true, employers should be raising wages to lure workers back to work. That didn’t happen. Average nominal hourly earnings stagnated in February, rising exactly 0.0% from January. (Experts were expecting a 0.5% gain, Month-over-Month.) Similarly, the 5.8% gain in average hourly earnings that so-called experts expected, year-over-year, came in at just 5.1%.
Worse, year-over-year CPI inflation in February came in at 7.9% This is beginning to get serious even by the standards of the 1960s-1980s Great Inflation.
![]()
It means that most Americans suffered wage cuts.
A more detailed picture of how native-born American workers have fared vis-à-vis immigrants is published in Table A-7 of the monthly BLS Report:
|
Employment Status by Nativity, Feb. 2021-Feb. 2022
|
|
(numbers in 1000s; not seasonally adjusted)
|
|
|
Feb-21
|
Feb-22
|
Change
|
% Change
|
|
|
Foreign born, 16 years and older
|
|
Civilian population
|
43,373
|
44,718
|
1,345
|
3.10%
|
|
Civilian labor force
|
27,946
|
29,229
|
1,283
|
4.59%
|
|
Participation rate (%)
|
64.4
|
65.4
|
1.0%pts.
|
1.55%
|
|
Employed
|
25,862
|
28,138
|
2,276
|
8.80%
|
|
Employment/population (%)
|
59.6
|
62.9
|
3.3%pts.
|
5.54%
|
|
Unemployed
|
2,084
|
1,092
|
-992
|
-47.60%
|
|
Unemployment rate (%)
|
7.5
|
3.7
|
-3.8%pts.
|
-50.67%
|
|
Not in labor force
|
15,428
|
15,489
|
61
|
0.40%
|
|
|
Native born, 16 years and older
|
|
Civilian population
|
217,545
|
218,606
|
1,061
|
0.49%
|
|
Civilian labor force
|
132,062
|
134,495
|
2,433
|
1.84%
|
|
Participation rate (%)
|
60.7
|
61.5
|
0.8%pts.
|
1.32%
|
|
Employed
|
123,660
|
128,805
|
5,145
|
4.16%
|
|
Employment/population (%)
|
56.8
|
58.9
|
2.1%pts.
|
3.70%
|
|
Unemployed
|
8,402
|
5,691
|
-2,711
|
-32.27%
|
|
Unemployment rate (%)
|
6.4
|
4.2
|
-2.2%pts.
|
-34.38%
|
|
Not in labor force
|
85,483
|
84,110
|
-1,373
|
-1.61%
|
|
Source: BLS, The Employment Situation, February 2022. Table A-7, February 4, 2022.
|
|
http://www.bls.gov/news.release/pdf/empsit.pdf
|
| |
|
|
|
|
|
From February 2021 to February 2022:
- Immigrant employment rose by 2.278 million, an eye-popping 8.8%, while native-born employment rose by 5.145 million, a 4.2% gain. ADVANTAGE IMMIGRANTS.
- The immigrant adult population rose by 1.345 million, a gain of 3.10%, Y-O-Y, while the corresponding native-born population increased 1.061 million—a 0.49% rise. ADVANTAGE IMMIGRANTS.
- The immigrant labor force (people working or looking for work) grew by 4.59%, more than twice the 1.84% gain in the native-born American labor force. ADVANTAGE IMMIGRANTS.
- Labor Force Participation Rates rose for both native-born Americans and immigrants, but the 1.0 %point (or 1.55%) gain for immigrants was larger than the corresponding gains for native-born workers. ADVANTAGE IMMIGRANTS.
- For most of the pandemic, unemployment rates have been higher for immigrants than native-born. (There are many reasons for this, foremost among them: the low-wage jobs filled disproportionately by immigrants preclude remote employment.) But in February the relative positions changed: the seasonally unadjusted unemployment rate for foreign-born adults (3.7%) was below the corresponding rate for native-born (4.2%). Over the past year unemployment rates for immigrants fell by 3.8 percentage points, versus a 2.2 percentage point decline for native-born Americans. As of February 7.5% of immigrants, and 6.4% of native-born Americans, were unemployed. ADVANTAGE IMMIGRANTS.
- 5.691 million native-born, and 1.092 million immigrants, were unemployed in February; over the past 12 months the number of unemployed immigrants fell by 47.6%, while native-born American jobless declined by 32.3%. ADVANTAGE IMMIGRANTS.
The big picture: The U.S. economy still has roughly 2 million fewer jobs than before the mass layoffs that began two years ago this month. And immigrants, legal and illegal, seem likely to edge out Americans in the recovery—and to beat down the wages of those Americans who succeed in getting jobs.
Peter Brimelow [Email him] is the editor of VDARE.com. His best-selling book, Alien Nation: Common Sense About America’s Immigration Disaster, is now available in Kindle format.