America’s hiring slowdown continued in December. Businesses added 199,000 workers, the smallest gain of the year, according to the widely cited Survey of Employer Payrolls. This was overwhelmed by the Immigrant Workforce Population growth (1.2 million year-over-year). Biden seized on wage growth, again ignoring that wage growth is negative when adjusted for inflation [Biden touts strong December wage increases, brushes off weak job growth, by Christina Wilkie, CNBC, January 7, 2022].
But despite the miss on headlines, the seasonally adjusted unemployment rate improved more than expected to 3.9%—the best level since February 2020’s 50-year low of 3.5%.
How can weak job growth coexist with sharp declines in unemployment? Labor force gurus are finally questioning the validity of the Payroll Survey, long deemed the Holy Grail of monthly job reports: "While the 199,000 gain in non-farm payrolls once again disappointed the consensus, a much larger gain in the household measure of employment and a tepid rise in participation pushed the unemployment rate back below 4%," Michael Pearce, senior U.S. economist for Capital Economics, wrote in a note on Friday [December jobs report: Payrolls rise by 199,000 as unemployment rate falls to 3.9%, by Emily McCormick, Yahoo Finance, January 13, 2022].
Mr. Pearce obviously is not a VDARE.com reader. For years, we have noted problems with the Payroll Survey. It consistently reports a total U.S. employment figure that is millions below that reported in the Survey of Households. Our contention: U.S. businesses are reluctant to acknowledge illegals on their payrolls—very much a factor in the undercount.
So no VDARE.com reader should be surprised that the December Household Survey reports a monthly employment gain of 651,000—a figure three times larger than the job growth reported in the Payroll Survey.
The Household Survey now reports December’s job growth by nativity. So December’s data, calculated exclusively by VDARE.com, was as follows:
- Immigrants (legal and illegal, the Federal government does not distinguish) lost 34,000 jobs, a 0.12% reduction from November.
- Native-born Americans gained 685,000 positions, a 0.54% rise from November.
- Thus VDARE.com’s immigrant employment index, set at 100.0 in January 2009, fell to 128.1 from 128.2 in November, a 0.03% decline.
- VDARE.com’s Native-born employment index rose to 106.4 from 105.7 in November, a gain of 0.45%.
- As a result the New VDARE.com American Worker Displacement Index (NVDAWDI), our name for the ratio of the immigrant to native-born American employment growth indexes since Jan. 2009, fell slightly last month to 120.5 from 121.3—a 0.66% decline.
Bottom line: VDARE.com’s displacement metric fell a bit last month. But the underlying trend is unbroken—despite 1.069 million immigrants reported as unemployed in December, the immigrant workforce population expanded by more than one million for the fourth straight month:
Note carefully what this chart shows. Unlike our other charts, which show absolute values, this one compares each month to the same month of the prior year. So the immigrant workforce population grew by 1.225 million in December 2021 compared to December 2020. The corresponding increases for October and November were 1.558 million, and 1.318 million, respectively.
For most of 2020, Trump’s last year, the population of working-age immigrants declined year-over-year. This far exceeded the net exodus during the 2008 Great Recession, and the brief net exodus during Trump’s first year, when his mere presence seemed to have jawboned illegals into fleeing.
The immigrant Work Force population started growing again only in December 2020—when the election results spurred a renewed invasion.
Another displacement metric—the immigrant share of total employment—also rose to levels not seen since before the pandemic. Our analysis shows that 17.781% of jobs were held by immigrants in December. Not since February 2019—when foreign-born workers held 17.812% of all jobs—has the immigrant share been above the level reached last month.
Note that, after some gyrations, the immigrant share of employment had been falling steadily even before the pandemic started. But, again, the Trump gains have been wiped out and the immigrant share is resuming its Obama-Era upward march.
Each 1% rise in immigrant employment share represents a transfer of about 1.5 million jobs from native-born Americans to immigrants.
As worker demand remains elevated, nominal wages have also risen. Average hourly earnings rose for the ninth straight month, increasing by 0.6% in December compared to November. Average hourly wages rose by 4.7% over last December vs. 4.2% expected and a revised 5.1% on November, as reported by Emily McCormick above.
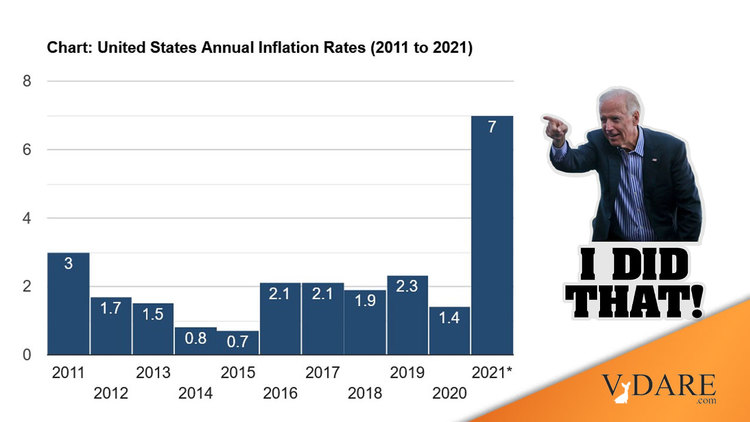
But inflation has eroded most, if not all, of the nominal wage gains. The government's latest report on CPI inflation (it is for November) showed an increase of 6.8%, year-over-year—the most since June 1982.
The US Inflation Calculator Page, more recently, makes it a straight 7 percent.
![]()
A more detailed picture of how native-born American workers have fared vis-à-vis immigrants is published in Table A-7 of the monthly BLS Report:
|
Employment Status by Nativity, Dec.2020-Dec.2021
|
|
(numbers in 1000s; not seasonally adjusted)
|
|
|
Dec-20
|
Dec-21
|
Change
|
% Change
|
|
|
Foreign born, 16 years and older
|
|
Civilian population
|
42,947
|
44,172
|
1,225
|
2.85%
|
|
Civilian labor force
|
27,529
|
28,760
|
1,231
|
4.47%
|
|
Participation rate (%)
|
64.1
|
65.1
|
1.0pts.
|
1.56%
|
|
Employed
|
25,512
|
27,691
|
2,179
|
8.54%
|
|
Employment/population (%)
|
59.4
|
62.7
|
3.3pts.
|
5.56%
|
|
Unemployed
|
2,017
|
1,069
|
-948
|
-47.00%
|
|
Unemployment rate (%)
|
7.3
|
3.7
|
-3.6pts.
|
-49.32%
|
|
Not in labor force
|
15,418
|
15,412
|
-6
|
-0.04%
|
|
|
Native born, 16 years and older
|
|
Civilian population
|
218,283
|
217,964
|
-319
|
-0.15%
|
|
Civilian labor force
|
132,487
|
132,935
|
448
|
0.34%
|
|
Participation rate (%)
|
60.7
|
61.0
|
0.3pts.
|
0.49%
|
|
Employed
|
124,101
|
128,041
|
3,940
|
3.17%
|
|
Employment/population (%)
|
56.9
|
58.7
|
1.8pts.
|
3.16%
|
|
Unemployed
|
8,387
|
4,894
|
-3,493
|
-41.65%
|
|
Unemployment rate (%)
|
6.3
|
3.7
|
-2.6pts.
|
-41.27%
|
|
Not in labor force
|
85,795
|
85,029
|
-766
|
-0.89%
|
|
Source: BLS, The Employment Situation, December 2021. Table A-7, January 7, 2022.
|
|
PDF
|
From December 2020 to December 2021:
- Immigrant employment rose by 2.179 million, an eye-popping 8.54%, while native-born American employment rose by 3.940 million, a 3.17% gain. ADVANTAGE IMMIGRANTS
- For the second straight month native-born American and foreign-born adult populations moved in different directions. The immigrant adult population rose by 1.225 million, a gain of 2.85% Y-O-Y, while the corresponding native-born population fell by 319,000—a 0.15% decline. ADVANTAGE IMMIGRANTS
- The immigrant labor force (people working or looking for work) grew 4.47%, a whopping 13 times the 0.34% growth of the native-born labor force. ADVANTAGE IMMIGRANTS Some commentators note that the Household Survey is better at counting people who found jobs in small businesses after losing payroll jobs in the pandemic, and that this may explain part of the burgeoning labor-force gap between immigrants and native-born Americans.
- Labor Force Participation Rates rose for both native-born Americans and immigrants, but the 1.0% point (or 1.56%) gain for immigrants was about three times as large as the corresponding gains for native-born American workers. While immigrant LPRs have historically been above those of native-born, the gap grew over the past year, from 3.4 %points in December 2020 to 4.1 %points this December. ADVANTAGE IMMIGRANTS
- For most of the pandemic unemployment rates have been higher for immigrants than native-born Americans. There are many reasons for this—foremost among them: the low-wage jobs filled disproportionately by immigrants preclude remote employment. This December unemployment rates for immigrants and native born were identical: 3.7%. Last December, 7.3% of immigrants, and 6.3% of native-born, were unemployed—so immigrants saw a larger decline, Y-O-Y. ADVANTAGE IMMIGRANTS
- 4.894 million native-born, and 1.069 million immigrants, were unemployed in December; over the past 12 months the number of unemployed immigrants fell by 47.0%, while native-born American jobless declined by 41.7%. ADVANTAGE IMMIGRANTS
Slackening job growth is especially worrisome because the latest BLS data was collected in mid-December, before the pandemic’s latest wave.
But that’s not stopping the immigrant influx. Immigrant Displacement of American workers is now back above Obama-Era levels. Look for it to go higher.