[Research by Edwin S. Rubenstein]
August’s job report was as usual vigorously spun by the Regime Media and the Biden White House [US hiring slows but remains strong, as economy adds 315,000 jobs, by Max Zahn, ABC News, September 2, 2022]. But data released since then—illegal border crossings, inflation, Federal Reserve interest rate hike—has been a series of hammer blows. Basically, American workers are earning less and facing recession. And, as usual unreported by anyone except VDARE.com, the fact is that those vigorously spun job numbers also contain the news that immigrants are continuing to edge out American workers.
Et tu, Breitbart? Even the generally excellent Breitbart Business Digest echoed the Regime Media’s endless flow of Democrat talking points after the September 2 release of August’s jobs data: “The morning after President Joe Biden delivered his Dark Brandon at the Gates of Hell speech, the Labor Department delivered a jobs report that was pretty close to perfect” [Breitbart Business Digest Dark Brandon vs. the Labor Market, by John Carney, September 2022].
That was because the Payroll Survey suggested a hiring slowdown, supposedly a sign that inflation is cooling. But the parallel Household Survey, regularly ignored by pundits for reason we don’t understand, showed hiring still surging. And more important from VDARE.com’s perspective: the Household Survey showed continued immigrant displacement of American workers
Employers added 315,000 people to their payrolls last month, down sharply from the 526,000 they hired in July. But the Household Employment Survey reported employment rose by 442,000 in August, more than doubling its anemic 179,000 gain in July.
Household Survey figures are invariably above Payroll Survey figures. One likely explanation: U.S. businesses are reluctant to acknowledge illegals working “off the books.” In August the employment “gap” between the surveys rose to 5.958 million, up by 3.55% from July’s 5.754.
The Household Survey is of particular interest to VDARE.com, because since 2010 it disaggregates employment trends by nativity. Both native-born Americans and immigrants gained jobs in August. But immigrant job gains were more robust. So American Worker Displacement rose.
In August:
- Immigrants (legal and illegal, government data does not distinguish) gained 113,000 jobs, a 0.40% gain from July.
- Native-born Americans gained 329,000 positions, a 0.25% increase from July.
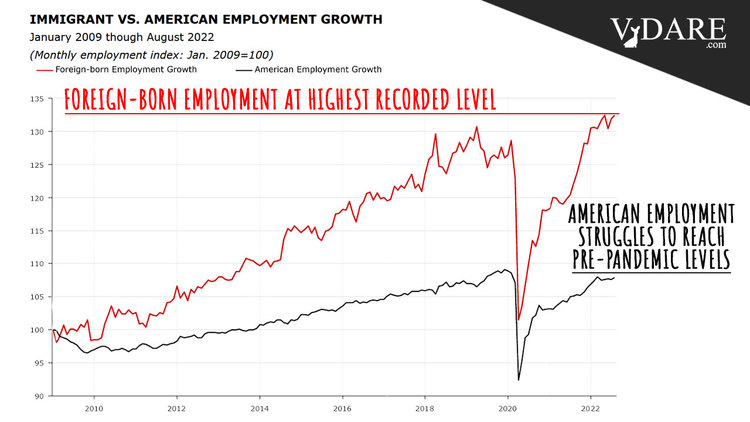
- Thus VDARE.com’s immigrant employment index, set at 100.0 in January 2009, rose to 132.4 in August from 131.9 in July, a 0.40% increase.
- VDARE.com’s native-born American employment index also rose last month, to 107.9 from 107.6, a 0.25% rise.
So the New VDARE American Worker Displacement Index (NVDAWDI), our name for the ratio of the immigrant to native-born employment growth indexes since January 2009, rose to 122.7 in August from 122.5 in July, a 0.14% increase.
The record NVDAWDI (123.0) was set in May this year.
Despite the 1.163 million immigrants reported as unemployed in August, the foreign-born work force population expanded by about 2 million, year-over-year, for the fifth consecutive month.
Never over the past 15 years has the immigrant work force population expanded this much, for this long:
Note carefully what this chart shows. Unlike our other charts, which show absolute values, this one compares each month to the same month of the prior year. So the immigrant workforce population grew by 1.97 million in August compared to July 2021. The corresponding increases for May and June, and July were 2.361 million, 2.058 million and 2.038 million, respectively.
Under Trump, after August 2019, i.e., beginning before COVID the population of working-age immigrants declined for more than a year. This far exceeded the net exodus during the 2008 Great Recession, and the brief net exodus during Trump’s first year, when his mere presence seemed to have jawboned illegals into fleeing.
The immigrant population of working age started growing again only in December 2020—when Biden’s reported victory spurred a renewed invasion.
Another displacement metric, the immigrant share of total employment, rose to 18.053% in August, up from 18.032% in July, and 17.947% in June. This is almost back to the May 2022 figure (18.089%), which was the highest since we started tracking employment by nativity in January 2010:
The August Household Survey reported 158.3 million people held jobs in the U.S. Each 1% rise in immigrant employment share represents a transfer of about 1.58 million jobs from native-born Americans to immigrants.
(Note that the immigrant share of U.S. employment data does not include the labor market impact of their U.S.-born children—citizens, even for children of illegals under the current misinterpretation of the 14th Amendment. We haven’t looked at this for a while, but it probably increases income reduction for legacy American workers by as much as half.)
A more detailed picture of how native-born American workers fared over the past year vis-à-vis immigrants is published in Table A-7 of the monthly BLS Report:
|
Employment Status by Nativity, Aug. 2021-Aug. 2022
|
|
(numbers in 1000s; not seasonally adjusted)
|
|
|
Aug-21
|
Aug-22
|
Change
|
% Change
|
|
|
Foreign born, 16 years and older
|
|
Civilian population
|
42,890
|
44,860
|
1,970
|
4.59%
|
|
Civilian labor force
|
27,916
|
29,817
|
1,901
|
6.81%
|
|
Participation rate (%)
|
65.1
|
66.5
|
1.4%pts.
|
2.15%
|
|
Employed
|
26,453
|
28,654
|
2,201
|
8.32%
|
|
Employment/population (%)
|
61.7
|
63.9
|
2.2%pts.
|
3.57%
|
|
Unemployed
|
1,464
|
1,163
|
-301
|
-20.56%
|
|
Unemployment rate (%)
|
5.2
|
3.9
|
-1.3%pts.
|
-25.00%
|
|
Not in labor force
|
14,973
|
15,043
|
70
|
0.47%
|
|
|
Native born, 16 years and older
|
|
Civilian population
|
218,721
|
219,324
|
603
|
0.28%
|
|
Civilian labor force
|
133,872
|
135,153
|
1,281
|
0.96%
|
|
Participation rate (%)
|
61.2
|
61.6
|
0.4%pts.
|
0.65%
|
|
Employed
|
126,779
|
130,060
|
3,281
|
2.59%
|
|
Employment/population (%)
|
58.0
|
59.3
|
1.3%pts.
|
2.24%
|
|
Unemployed
|
7,092
|
5,093
|
-1,999
|
-28.19%
|
|
Unemployment rate (%)
|
5.3
|
3.8
|
-1.5%pts.
|
-28.30%
|
|
Not in labor force
|
84,850
|
84,170
|
-680
|
-0.80%
|
|
Source: BLS, The Employment Situation, August 2022. Table A-7, September 2, 2022. http://www.bls.gov/news.release/pdf/empsit.pdf
|
From August 2021 to August 2022:
- Immigrant employment rose by 2.201 million, an eye-popping 8.32% gain, while native-born American employment rose just 3.281 million, a 2.60% gain. ADVANTAGE IMMIGRANTS
- The immigrant population of working-age rose by 1.970 million, a gain of 4.59%, Y-O-Y, while the corresponding native-born American population increased by 603,000—a 0.28% rise. THE IMMIGRANT ADULT POPULATION GREW 16.4 TIMES FASTER THAN THE NATIVE-BORN ADULT POPULATION. ADVANTAGE IMMIGRANTS.
- The immigrant labor force (people working or looking for work) grew by 6.81%, roughly 7.1 times the 0.96% gain in the native-born American labor force. ADVANTAGE IMMIGRANTS
- Labor Force Participation Rates rose for both native-born Americans and immigrants, but the 1.4 point (2.15%) gain for immigrants was 3.3 times larger than the 0.65% percentage gain for native-born American workers. ADVANTAGE IMMIGRANTS
- Unemployment rates for native-born American workers fell by 1.5 percentage points, or 28.3%, while the immigrant unemployment rate fell by 1.3 % points, or 25.0%. ADVANTAGE NATIVE-BORN AMERICANS
- 5.093 million native-born Americans, and 1.163 million immigrants, were unemployed in August; over the prior 12 months the number of unemployed immigrants fell by 20.6%, while native-born American jobless declined by 28.2%. ADVANTAGE NATIVE-BORN AMERICANS
The big picture: August numbers showed a continued high demand for labor, but even faster growth in the number of people looking for jobs. One troubling result: The unemployment rate rose to 3.7% from a half-century low of 3.5% in July.
Notwithstanding which, illegal immigration continues to surge well above pre-Biden levels:
Remember, most of those “apprehensions” are released into the U.S. [August Border Encounters Back Up, U.S. Surpasses 2M For First Time, NumbersUSA, September 20, 2022].
The Bureau of Labor Statistics also reported that from August 2021 to August 2022 hourly earnings rose 5.5%
But this was outpaced by inflation. The Consumer Price Index rose 8.3% year-over-year in August, above expectations. So real hourly earnings actually decreased year-over-year by some 2.8% [Economic News Release—Real Earnings Summary, BLS, September 21, 2022].
It’s very hard to believe that this will not be a political problem for Democrats in the mid-term elections.
The Federal Reserve obviously does not think that this month’s economic data is “pretty close to perfect.” It just raised interest rates savagely, and signals that it will continue until inflation subsides [Federal Reserve hikes key interest rate 0.75 percentage point, projects economic slowdown, by Irina Ivanova, CBS, September 21, 2022]. The best scenario envisaged now: slow growth and rising unemployment [Forget a soft landing. The market’s best hope is a ‘growth’ recession, by Nicole Goodkind, CNN, September 27, 2022].
You might think that might mean a renewed—well, actually a new—interest in reducing labor market competition by restricting immigration.
But you’d be wrong: the Uniparty was able to go through the 2008-9 recession without addressing continuing immigration at all.
That’s why you have to keep reading, and sharing, VDARE.com.
Peter Brimelow [Email him] is the editor of VDARE.com. His best-selling book, Alien Nation: Common Sense About America’s Immigration Disaster, is now available in Kindle format.