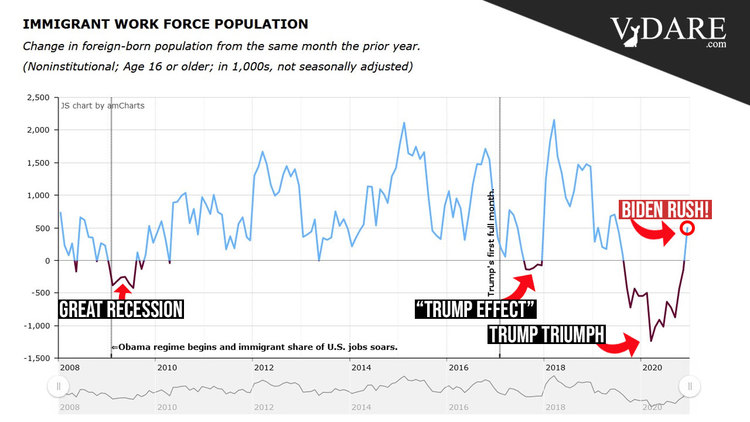
It didn’t take long for Joe Biden to put his mark on the U.S. workforce. After 15 straight months of year-over-year decline, the immigrant workforce population (legal and illegal—government data doesn’t distinguish) jumped by a shocking 509,000 year-over-year. We are not surprised. This spike in immigrant workers, coming as it does before Biden has actually taken office, reminds us of the early “Trump Effect,” when net immigration slowed dramatically before Mr. Trump was in the White House or had a chance to do anything.
This is particularly worrying because the economic rebound went into reverse in December. Employers laid off 140,000 workers according to the BLS. This is the first net decline in payrolls since last spring’s mass layoffs. The U.S. economy still has about 10 million fewer jobs than before the pandemic began.
The unemployment rate was unchanged at 6.7%, down sharply from its high of nearly 15% in April but still close to double the 3.5% rate in the same month a year earlier.
Looking for (comparatively) good news? You’ll find it in the “other” employment survey, of households rather than businesses.
Our analysis of the December Household Survey finds:
- Total employment rose by 98,000, a 0.1% increase from November.
- Immigrants (legal and illegal) lost 15,000 jobs, down 0.1% from November.
- Native-born Americans gained 113,000 jobs, up 0.1% from November.
- VDARE.com’s immigrant employment index, set at 100.0 in January 2009, fell to 118.0 from 118.1 in November, a 0.1% decline.
- The native-born American employment index rose to 103.1 from 103.0 in November, a 0.1% increase. At 103.1, the December index indicates that 3.1% more native-born American workers held jobs last month than in January 2009, Obama’s first year in office.
This means that the New VDARE American Worker Displacement Index (NVDAWDI), our name for the ratio of immigrant to native-born American employment growth indexes since Jan. 2009, fell to 114.5 from 114.7 in November, a 0.2% drop.
So immigrant displacement of American workers, which had been creeping back up, has stalled.
For now.
The December data, the last of President Trump’s time in office, marks the end of a year of violent swings in the labor market. Employers cut 22 million jobs in March and April, then began rehiring furloughed workers en masse in May and June. By August, the economy had regained close to half of the lost jobs.
But momentum faded. Hiring has slowed every month since June, and the economy lost millions of jobs in 2020 as a whole, the first calendar-year decline since 2010.
From the start of the Trump Administration (January 2017) through December 2020, native-born Americans lost 1.813 million jobs, a 1.4% decline, while immigrants lost 438,000, a 1.7% reduction.
So if native-born workers were to evaluate the Trump years on how they did relative to immigrants, it would still be a positive judgment—albeit barely.
By comparison, the same calculation a few months ago showed a decisive advantage for native-born Americans workers. The percentage job losses suffered by native-born American workers from Trump’s inauguration through October 2020 were less than one-quarter of those endured by immigrants over that period.
Bottom line: November was a crucial turning point—and not just because of the election. It saw a big spike in American worker displacement. Not since March was VDARE.com’s Displacement Index as high as it was that month. December’s modest displacement retreat does not come close to repairing the damage.
Displacement is, of course, a relative term. It measures immigrant job growth relative to that of American native-born workers. Thanks, in part, to Trump’s (relatively) hard line on immigration, expressed basically via administrative measures, the Trump years saw a labor market where native-born Americans first held the line and then, in the COVID contraction, lost relatively fewer jobs than immigrants.
That was not what Trump supporters had in mind in November 2016. But it was something. Now, after a dismal November and lackluster December, even that “something” has shrunk.
Another way of measuring displacement: the immigrant share of total employment.
Our analysis of the December report shows the immigrant share of total employment fell to 17.05% from 17.07% in November. After some gyrations, it had been falling steadily before the pandemic started. In February 2020 immigrants held 17.53% of all jobs.
Each 1% decline in immigrant employment share represents a transfer of about 1.5 million jobs from immigrants to native-born workers.
The most troubling news for immigration patriots: as discussed above, December saw an abrupt end to the 15-month net exodus of working-age immigrants. The Immigrant Workforce Population grew by 509,000 from last December.
The decline in immigrant workers during the 15 month-long “Trump Triumph” (September 2019 through November 2020) was much greater that we saw in the 2008 Great Recession. Back then, immigrants were leaving at the rate of 300,000 to 400,000 a month, year-over-year. And of course, it dwarfs the brief decline seen earlier in the Trump Administration.
Also troubling, illegal immigration across the southern border seems to be surging again.
A more detailed picture of how American workers have fared vis-à-vis immigrants is published in Table A-7 of the monthly BLS Report:
|
|
Employment Status by Nativity, Dec.2019-Dec.2020
|
|
|
(numbers in 1000s; not seasonally adjusted)
|
|
|
|
Dec-19
|
Dec-20
|
Change
|
% Change
|
|
|
|
Foreign born, 16 years and older
|
|
|
Civilian population
|
42,438
|
42,947
|
509
|
1.20%
|
|
|
Civilian labor force
|
28,086
|
27,529
|
-557
|
-1.98%
|
|
|
Participation rate (%)
|
66.2
|
64.1
|
-2.1pts.
|
-3.17%
|
|
|
Employed
|
27,223
|
25,512
|
-1,711
|
-6.29%
|
|
|
Employment/population (%)
|
64.1
|
59.4
|
-4.7pts.
|
-7.33%
|
|
|
Unemployed
|
863
|
2,017
|
1,154
|
133.72%
|
|
|
Unemployment rate (%)
|
3.1
|
7.3
|
4.2pts.
|
135.48%
|
|
|
Not in labor force
|
14,352
|
15,418
|
1,066
|
7.43%
|
|
|
|
Native born, 16 years and older
|
|
|
Civilian population
|
217,743
|
218,283
|
540
|
0.25%
|
|
|
Civilian labor force
|
135,921
|
132,487
|
-3,434
|
-2.53%
|
|
|
Participation rate (%)
|
62.4
|
60.7
|
-1.7pts,
|
-2.72%
|
|
|
Employed
|
131,281
|
124,101
|
-7,180
|
-5.47%
|
|
|
Employment/population (%)
|
60.3
|
56.9
|
-3.4pts.
|
-5.64%
|
|
|
Unemployed
|
4,640
|
8,387
|
3,747
|
80.75%
|
|
|
Unemployment rate (%)
|
3.4
|
6.3
|
2.9pts.
|
85.29%
|
|
|
Not in labor force
|
81,822
|
85,795
|
3,973
|
4.86%
|
|
|
Source: BLS, The Employment Situation, December 2020. Table A-7, January 8, 2021. PDF
|
| |
|
| |
|
|
|
|
|
|
From December 2019 to December 2020:
- The native-born working-age population rose by 540,000, a gain of 0.25%; the corresponding immigrant population rose by 509,000—a 1.20% rise ADVANTAGE IMMIGRANTS.
- Both native-born and immigrants suffered large job losses, year-over-year; native-born lost 7.18 million positions, a 5.47% decline, while foreign-born workers were hit harder, losing 1.711 million jobs, a 6.3% loss. ADVANTAGE NATIVE-BORN AMERICANS.
- The immigrant labor force (working or looking for work) fell by 567,000, or 1.98%; the native-born labor force fell by 3.434 million, a 2.53% drop. ADVANTAGE NATIVE-BORN AMERICANS.
- The unemployment rate for native-born Americans rose 85.3%, from 3.4% to 6.3%; over that period the immigrant unemployment rate rose 135.5%, from 3.1% to 7.3%. ADVANTAGE NATIVE-BORN AMERICANS
- 8.39 million native-born and 2.02 million immigrants were unemployed in December but since last December the number of unemployed immigrants rose by 134%, while the number of native-born jobless rose by “only” 81%. ADVANTAGE NATIVE-BORN AMERICANS
- Labor force Participation Rates fell for both immigrants and native-born Americans, with the immigrant LPR falling by 2.1 percentage points, or by 3.2%, while the native-born American rate fell by 1.7 percentage points, or 2.7%. ADVANTAGE NATIVE-BORN AMERICANS
- As far as unemployment rates are concerned, immigrant workers lost ground relative to native-born Americans. Last December the unemployment rate for foreign-born workers was below that of native-born, 3.1% versus 3.4%. This year the positions are reversed, with native-born unemployment at 6.3% and the immigrant rate at 7.3%. ADVANTAGE NATIVE-BORN AMERICANS
Trump had a great opportunity: He could have locked in the recovery’s benefits for the American worker—and stemmed recent immigration’s damage to the GOP—if he had acted on his instincts and campaigned on making permanent his temporary immigration moratorium.
But Trump missed the chance to make this point. Now his achievements will almost certainly be overwhelmed by the Biden Rush.
It will be up to the next generation of patriot politicians to save America.
Edwin S. Rubenstein (email him) is President of ESR Research Economic Consultants