[Research by Edwin S. Rubenstein]
Of course the Regime Media hyped the May 6 jobs report [Job Growth Shows Continuing Vigor of U.S. Economy, by Talmon Joseph Smith, NYT, May 6, 2022]. But unreported except here on VDARE.com: immigrants gained the bulk of the new jobs; American employment actually fell. Immigrant displacement of American workers is at an all-time high, resuming its relentless upward march that dates back to Obama’s inauguration. Also, inflation significantly exceeded wage growth. So, contrary to advertisement, Americans’ incomes are falling.
According to the widely-cited Payroll Survey, the economy added back 428,000 jobs in April, as the unemployment rate stayed at 3.6%—slightly above its pre-COVID 3.5%. Labor force participation unexpectedly dipped to 62.2% from March’s 62.4%, suggesting a smaller share of the population was working or looking for work.
"Almost 500,000 workers decided to leave the workforce in April… Currently, there are 11.5 million job openings and only 5.9 million unemployed, causing a large mismatch in labor supply and demand that’s fueling wage growth,” Peter Essele, Head of Portfolio Management for Commonwealth Financial Network, said [April jobs report: Payrolls rise by 428,000 as unemployment rate holds at 3.6%, by Emily McCormick, Yahoo News, May 6, 2022].
We are told incessantly that the labor market is strong, that the demand for labor is far greater than the supply. If true, employers should be raising wages to lure workers back to work. But that didn’t happen: workers are still losing ground to inflation, with average hourly earnings up 5.5%, year-over-year, in April, while the CPI rose at an annualized rate of 8.3% in April [Inflation barreled ahead at 8.3% in April from a year ago, remaining near 40-year highs, by Jeff Cox, CNBC, May 11, 2022].
The Household Employment Survey shows a far bleaker picture of the macro job situation for April: total employment shrank by 353,000—a 0.2% drop—with immigrants (legal and illegal, federal data does not distinguish) gaining jobs while native-born Americans were losing them. One likely explanation for the difference: U.S. businesses are reluctant to acknowledge illegals working “off the books.” This illicit workforce is counted in the Household Employment Survey, but not in the Payroll Employment Survey.
In April:
- Immigrants gained 274,000 jobs, a 1.0% increase from March
- Native-born Americans lost 627,000 positions, a 0.5% fall from March
- Thus VDARE.com’s immigrant employment index, set at 100.0 in January 2009, rose to 131.7 from 130.4 in March, a 1.0% increase
- VDARE.com’s Native-Born employment index fell to 107.5 from 108.0, a 0.5% decline.
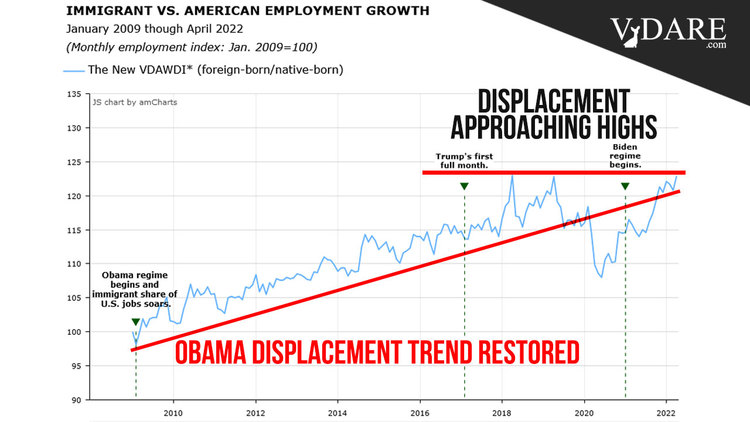
The New VDARE American Worker Displacement Index (NVDAWDI), our name for the ratio of the immigrant to native-born employment growth indexes since January 2009, rose to 122.9 in April from 120.8 in March, a gain of 1.8%.
Significantly, despite 970,000 immigrants reported as unemployed in April, the immigrant working-age population expanded by nearly 2 million (1.970 million) over the past 12 months. This was the largest gain, Y-O-Y, since February 2015:
Note carefully what this chart shows. Unlike our other charts, which show absolute values, this one compares each month to the same month of the prior year. So the immigrant workforce population grew by 1.970 million in April compared to April 2021. The corresponding increases for February and March were 1.345 million and 1.397 million, respectively.
For most of 2020, Trump’s last year, the population of working-age immigrants declined year-over-year. This far exceeded the net exodus during the 2008 Great Recession, and the brief net exodus during Trump’s first year, when his mere presence seemed to have jawboned illegals into fleeing.
The immigrant population of working age started growing again only in December 2020—when the election results spurred a renewed invasion.
This seems set to continue. As usual under the Biden Regime, Border Patrol apprehension data is slow to be released, but leaks reported in the Washington Post suggest April apprehensions were even higher than last month’s all-time high [Mexico will take back more Cubans and Nicaraguans expelled by U.S., by Nick Miroff and Kevin Sieff, May 4, 2022]:
![]()
Another displacement metric—the immigrant share of total employment—also rose substantially last month. Our analysis indicates that 18.031% of jobs were held by immigrants in April. The only month to exceed that level in the past 16 years was April 2018, when the immigrant share spiked to 18.083%.
At the time we called it a one-month anomaly, likely attributable to the random noise that affects all economic data at one time or another. With SW border crossings swelled by Ukrainians and Central Americans, that “anomaly” could now well become the new normal.
Note that, after some gyrations, the immigrant share of employment had been falling steadily even before the pandemic started.
But, again, the Trump gains have been wiped out and the immigrant share has resumed its Obama Era upward march.
In April 158.1 million people held jobs in the U.S. Each 1% rise in immigrant employment share represents a transfer of about 1.58 million jobs from native-born Americans to immigrants.
Job growth by nativity, calculated exclusively by VDARE.com from data in the Household Employment Survey, in April was as follows:
A more detailed picture of how native-born American workers have fared vis-à-vis immigrants is published in Table A-7 of the monthly BLS Report:
|
Employment Status by Nativity, Apr.2021-Apr.2022
|
|
(numbers in 1000s; not seasonally adjusted)
|
|
|
Apr-21
|
Apr-22
|
Change
|
% Change
|
|
|
Foreign born, 16 years and older
|
|
Civilian population
|
43,046
|
45,016
|
1,970
|
4.58%
|
|
Civilian labor force
|
27,644
|
29,458
|
1,814
|
6.56%
|
|
Participation rate (%)
|
64.2
|
65.4
|
1.2%pts.
|
1.87%
|
|
Employed
|
25,886
|
28,488
|
2,602
|
10.05%
|
|
Employment/population (%)
|
60.1
|
63.3
|
3.2%pts.
|
5.32%
|
|
Unemployed
|
1,758
|
970
|
-788
|
-44.82%
|
|
Unemployment rate (%)
|
6.4
|
3.3
|
-3.1%pts
|
-48.44%
|
|
Not in labor force
|
15,402
|
15,558
|
156
|
1.01%
|
|
|
Native born, 16 years and older
|
|
Civilian population
|
218,057
|
218,544
|
487
|
0.22%
|
|
Civilian labor force
|
132,735
|
133,992
|
1,257
|
0.95%
|
|
Participation rate (%)
|
60.9
|
61.3
|
0.4%pts.
|
0.66%
|
|
Employed
|
125,274
|
129,503
|
4,229
|
3.38%
|
|
Employment/population (%)
|
57.5
|
59.3
|
1.8%pts.
|
3.13%
|
|
Unemployed
|
7,462
|
4,488
|
-2,974
|
-39.86%
|
|
Unemployment rate (%)
|
5.6
|
3.3
|
-2.3%pts.
|
-41.07%
|
|
Not in labor force
|
85,321
|
84,552
|
-769
|
-0.90%
|
|
Source: BLS, The Employment Situation, April 2022. Table A-7, May 6, 2022.
|
|
PDF
|
| |
|
|
|
|
|
|
From April 2021 to April 2022:
- Immigrant employment rose by 2.602 million, an eye-popping 10.05%, while native-born American employment rose 4.229 million, a 3.4% gain. ADVANTAGE IMMIGRANTS
- The immigrant adult population rose by 1.970 million, a gain of 4.6%, year-over-year, while the corresponding native-born American population increased 487,000—a 0.22% rise. IMMIGRANT ADULT POPULATION GREW 21 TIMES FASTER THAN NATIVE-BORN AMERICAN ADULT POPULATION. ADVANTAGE IMMIGRANTS
- The immigrant labor force (people working or looking for work) grew by 6.56%, more than 7 times the 0.95% gain in the native-born labor force. ADVANTAGE IMMIGRANTS (The data in the table are from a survey of households which includes self-employed workers, agricultural workers, and private family workers, who are excluded from the more widely cited Payroll Survey. Also overlooked, we contend, are illegal immigrants working “off the books” in large corporations.)
- Labor Force Participation Rates rose for both native-born Americans and immigrants, but the 1.2% point (1.87%) gain for immigrants was three times larger than the corresponding gains for native-born American workers. ADVANTAGE IMMIGRANTS
- Unemployment rates for native-born American workers fell by 2.3 percentage points, or 41.1%, while the immigrant unemployment rate fell by 3.1 points, or 48.4%. ADVANTAGE IMMIGRANTS
- 4.488 million native-born Americans, and 970,000 immigrants, were unemployed in April; Over the past 12 months the number of unemployed immigrants fell by 44.8%, while native-born Americans jobless declined by 39.9%. ADVANTAGE IMMIGRANTS
The immigrant workforce population has been building throughout the Biden Regime. Now, finally, that seems to be showing up in the displacement data.
Peter Brimelow [Email him] is the editor of VDARE.com. His best-selling book, Alien Nation: Common Sense About America’s Immigration Disaster, is now available in Kindle format.