Earlier: Labor Day 2020: Riots—But, Because Of Trump, The Immigrant Workforce Population IS Falling
Funny thing: The Main Stream Media seems not to have noticed just how powerful is the economic rebound revealed by August’s jobs data. A whopping 3.4 million new jobs were created according to the Household Survey. July’s gain was a mere 1.4 million by comparison. If the August gain is reprised over the next few months, we will return to pre-pandemic employment levels by the end of the year. Even better for American workers: The immigrant workforce population (legal and illegal—the data does not discriminate) fell again. It has now been declining for a whole year. All that is needed now: a permanent immigration moratorium to make sure the rebound benefits Americans.
Why the August job spike? The expiration of extra federal unemployment benefits at the end of July may have encouraged more people to return to work because they needed the money. The start of the school year could have played a role. And the ongoing economic recovery and slow relaxation of coronavirus restrictions (at least in non-Democrat states) probably contributed, too.
More good news: The unemployment rate fell to 8.4%, down significantly from 14.7% in April and 10.2% in July. This is a remarkable achievement—especially with labor force participation rates rising.
Unemployment rates fell for Blacks, Hispanics, and Whites, in August.
Still, for the second straight month immigrants have gained jobs more rapidly than native-born:
In August:
- Immigrants gained 775,000 jobs, a 3.3% increase from July.
- Native-born Americans gained 2.98 million jobs, up 2.5% from July.
- VDARE.com’s immigrant employment index, set at 100.0 in January 2009, rose to 113.5 from 109.9 in July, a 3.3% gain.
- The native-born American employment index rose to 101.8 from 99.3 in July, a gain of 2.5%. At 101.8, the August index indicates that 1.8% more native-born American workers held jobs last month than in January 2009, Obama’s first year in office.
Accordingly, the New VDARE American Worker Displacement Index (NVDAWDI), our name for the ratio of immigrant to native-born American employment growth indexes since Jan. 2009, rose—to 111.5 in August from 110.6 in June.
Note that this displacement level is still low by historical standards. Not since May 2016 has VDARE.com’s Displacement Index been this low in normal—i.e., non-pandemic—times.
But the past two months might be a harbinger of things to come—a sign that the recovery from the pandemic is increasingly benefiting sectors like hotels and construction, where immigrants hold a disproportionate number of jobs.
July and August notwithstanding, the percentage job losses suffered by native-born American workers during Trump’s tenure are significantly less than those endured by immigrants. From January 2017 through July 2020 native-born Americans lost 6.3 million jobs, a 5.0% decline, while immigrants lost 2.2 million, an 8.5% reduction.
Thanks, in part, to Trump’s (relatively) hard line on immigration, expressed basically via administrative measures, the Trump years saw a labor market where native-born Americans lost relatively fewer jobs than immigrants.
This is not quite what Trump supporters had in mind in November 2016. But it’s something.
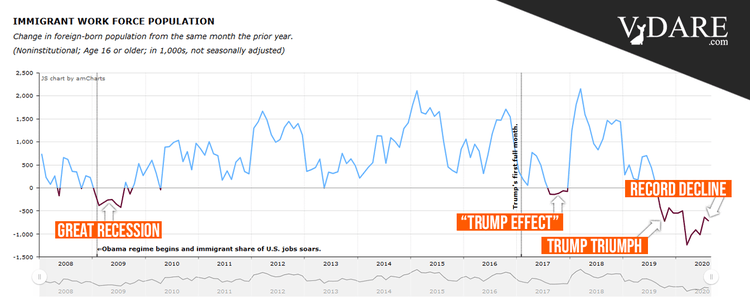
More good news for immigration patriots: August saw another decline in the foreign-born working-age population, year over year. It fell by 723,000 from August 2019—the 12th straight month of year-over-year decline. It seems to be accelerating: the population shrank by just 636,000 in July, year-over-year.
This current immigrant workforce decline is more than double that seen in the 2008 Great Recession. Back then immigrants were leaving at the rate of 300,000 to 400,000 a month, year-over-year. And it for exceeds the “Trump Effect” seen in the early months of the administration, when illegals apparently self-deported out of fear.
This decline was underway well before the pandemic hit. It has to be counted as a significant Trump achievement—a “Trump Triumph,” as we label it on our featured chart.
By further flushing out immigrants, COVID-19 seems to have accentuated an America-First trend already underway for some time—but it’s possible that immigrants may be about to return. Unemployed Americans need protecting by the institutionalization of President Trump’s administrative immigration moratorium.
Another way of measuring displacement: the immigrant share of total employment.
Our analysis of the August report shows the immigrant share rose to 16.68%, up slightly from 16.57% in July. As discussed above, it had been falling steadily before the pandemic started. In February 2020 immigrants held 17.53% of all jobs.
Each 1% decline in immigrant employment share represents a transfer of about 1.4 million jobs from immigrants to native-born workers.
|
A more detailed picture of how American workers have fared vis-à-vis immigrants is published in Table A-7 of the monthly BLS Report:
|
|
|
|
Employment Status by Nativity, Aug. 2019-Aug.2020
|
|
(numbers in 1000s; not seasonally adjusted)
|
|
|
Aug-19
|
Aug-20
|
Change
|
% Change
|
|
|
Foreign born, 16 years and older
|
|
Civilian population
|
42,764
|
42,041
|
-723
|
-1.69%
|
|
Civilian labor force
|
28,153
|
27,325
|
-828
|
-2.94%
|
|
Participation rate (%)
|
65.8
|
65.0
|
-0.8pts.
|
-1.22%
|
|
Employed
|
27,272
|
24,551
|
-2,721
|
-9.98%
|
|
Employment/population (%)
|
63.8
|
58.4
|
-5.4pts.
|
-8.46%
|
|
Unemployed
|
881
|
2,774
|
1,893
|
214.87%
|
|
Unemployment rate (%)
|
3.1
|
10.2
|
7.1pts.
|
229.03%
|
|
Not in labor force
|
14,611
|
14,716
|
105
|
0.72%
|
|
|
Native born, 16 years and older
|
|
Civilian population
|
216,668
|
218,517
|
1,849
|
0.85%
|
|
Civilian labor force
|
135,866
|
133,641
|
-2,225
|
-1.64%
|
|
Participation rate (%)
|
62.7
|
61.2
|
-1.5pts.
|
-2.39%
|
|
Employed
|
130,545
|
122,673
|
-7,872
|
-6.03%
|
|
Employment/population (%)
|
60.3
|
56.1
|
-4.2pts.
|
-6.97%
|
|
Unemployed
|
5,322
|
10,968
|
5,646
|
106.09%
|
|
Unemployment rate (%)
|
3.9
|
8.2
|
4.3pts.
|
110.26%
|
|
Not in labor force
|
80,802
|
84,876
|
4,074
|
5.04%
|
|
Source: BLS, The Employment Situation, August 2020. Table A-7. September 4, 2020. PDF
|
|
|
|
From August 2019 to August 2020:
- The native-born American working-age population grew by 1.849 million, a gain of 0.85%; the corresponding immigrant population fell by 723,000—a 1.69% decline. August 2020 was the 12th consecutive month in which the working age immigrant population declined, year-over-year. The August decline exceeded the July decline—indicating that the exodus of working age immigrants is accelerating.
- Both native-born Americans and immigrants suffered large job losses year-over-year; native-born lost 7.872 million positions, an 6.03% reduction; foreign-born workers were hit harder, losing 2.72 million jobs, a 9.98% loss. Both groups did better in August 2020 than in June 2020, i.e., their percentage job losses were significantly lower, year-over-year. While some may see this as “good news,” it is also evidence that an IMMIGRATION MORATORIUM is needed to preserve job gains for native-born workers.
- The immigrant labor force (working or looking for work) fell by 828,000, or 2.9%; the native-born labor force fell by 2.2 million, a 1.6% drop. Advantage native-born Americans.
- Unemployment rates for native-born Americans rose 110.3% year-over-year, from 3.9% last August to 8.2% in August 2020; while the immigrant unemployment rate rose 229%, from 3.1% to 10.2%. Advantage native-born Americans. Year-over-year unemployment rates for both groups rose by smaller percentages in August than in July, indicating the Trump recovery is accelerating—and benefitting both groups.
- Some 11 million native-born and 2.8 million immigrants were unemployed in August, but since August of last year the number of unemployed immigrants rose by 215%, while the number of native-born jobless rose by “only” 106%. Advantage native-born Americans.
- Labor force Participation Rates declined for both immigrants and native-born Americans, with the native-born LPR falling significantly more: down 1.5 points, or 2.39%, versus a 0.8 point, or 1.22%, decline for immigrants. As in July, the strong rebound in hotel, health care, and construction jobs—sectors that employ above-average numbers of foreign-born—softened the Y-O-Y decline in immigrant LPRs. Advantage immigrants.
In normal times about 300,000 working-age immigrants leave the country voluntarily. With immigrant job loses high in the pandemic, this number is undoubtedly larger today—but as economic recovery takes hold, they will try to return.
This presents Donald Trump with a great opportunity: He can lock in the recovery’s benefits for the American worker—and stem recent immigration’s damage to the GOP—if he acts on his instincts and imposes an immigration moratorium.
Unfortunately, whoever choreographed his convention was apparently unaware of this opportunity.
As usual, it’s up to Trump and his instincts on the campaign trail.
Edwin S. Rubenstein (email him) is President of ESR Research Economic Consultants.