[Research by Edwin S. Rubenstein]
American employers reported weaker than expected payroll growth last month. But the survey of American households showed a surge in the number taking jobs—with—surprise, surprise—immigrants gaining them at a rate far greater than natives.
Those conflicting pictures emerged from last Friday’s Bureau of Labor Statistics jobs report, further clouding the economic outlook.
The survey of employers showed the addition of just 210,000 jobs in November, the year’s weakest showing. Economists had forecast a second straight gain of more than 500,000.
But good news—for immigrants anyway—abounded in the household survey, which showed that the total number employed, seasonally adjusted, jumped by more than 1.1 million. The unemployment rate fell to 4.2% from 4.6%.
“I don’t know that I’ve ever seen such an extraordinary gap between the two surveys,” said Diane Swonk, chief economist for the accounting firm of Grant Thornton in Chicago [Stocks slide again after the jobs report sends mixed signals on the economy, New York Times, December 3, 2021].
Ms. Swonk is obviously not a VDARE.com reader. We have long noted that the survey of employer payrolls misses non-traditional workers—people selling things on CraigsList, working off-the-books, and…illegal immigrants. Last month’s data confirms the undercount, with payroll employment coming in at 148.6 million versus 155.2 million for Household Survey, both seasonally adjusted.
Our analysis of the November Household Survey finds:
- Immigrants (legal and illegal, the Household Survey does not distinguish) gained 565,000 jobs, a 2.08% increase from October.
- Native-born Americans gained 571,000 positions, a 0.45% increase from October.
- Thus VDARE.com’s immigrant employment index, set at 100.0 in January 2009, rose to 128.2 from 125.5 in October, a rise of 2.08%.
- VDARE.com’s Native-born employment index rose to 105.7 from 105.2 in October, a rise of 0.45%.
This means that the New VDARE American Worker Displacement Index (NVDAWDI), our name for the ratio of immigrant to native-born employment growth indexes since January 2009, rose to 121.3 from 119.3 in October, a 1.62% increase.
American Worker Displacement, as measured by NVDAWDI, was considerably higher in November (121.3) than it was when Donald Trump was inaugurated in January 2017 (114.8) After wild gyrations during his Administration, it finally fell, partly because of the pandemic, and partly because of his Executive Actions. In the months immediately after Biden’s inauguration it stabilized, but with the waning of the pandemic, immigrant workers surged back. While NVDAWDI has risen every month since July, October and November saw the largest spikes. This trend could signal a run of ever grimmer months for native-born American workers.
A resumption of the relentless increases of the Obama years now seems underway. Despite 1.043 million immigrants reported as unemployed in November, the foreign-born working-age population expanded by more than one million, Y-O-Y, for the third straight month:
Note carefully what this chart shows. Unlike our other charts, which show absolute values, this one compares each month to the same month of the prior year. So the immigrant workforce population grew by 1.318 million in November 2021 compared to November 2020. The corresponding increases for August, September, and October were 849,000, 1.301 million, and 1.558 million, respectively. These are huge increases.
For most of 2020, the population of working-age immigrants declined Y-O-Y. This far exceeded the net exodus during the 2008 Great Recession, and the brief net exodus during Trump’s first year, when his mere presence seemed to have jawboned illegals into fleeing.
The immigrant Work Force population started growing again only in December 2020—when the election results spurred a renewed invasion.
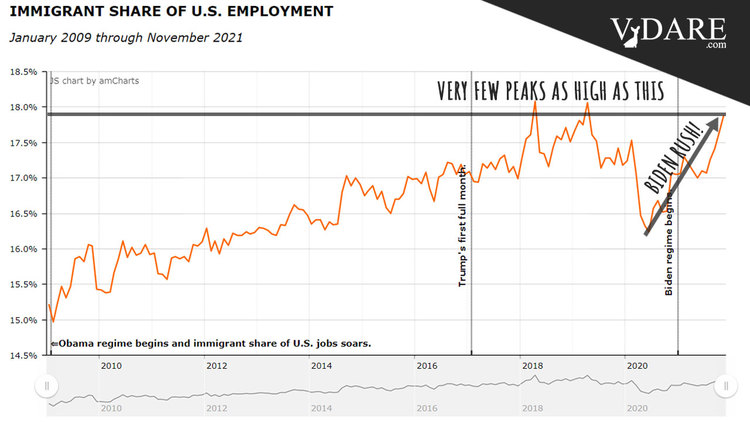
Another displacement metric—the immigrant share of total employment—also rose to levels not seen since before the pandemic.
Our analysis shows that 17.878% of jobs were held by immigrants in November. Not since April 2018 has the immigrant share been above the level reached last month.
Note that, after some gyrations, the immigrant share of employment had been falling steadily even before the pandemic started. But, again, the Trump gains have been wiped out and the immigrant share will resume its Obama-Era upward march—unless the political climate changes again.
Each 1% rise in immigrant employment share represents a transfer of about 1.5 million jobs from native-born Americans to immigrants.
As worker demand remains elevated, nominal wages have also risen. Average hourly earnings rose for an eighth straight month, increasing by 0.3% in November compared to October. Average hourly wages rose by 4.8% over November over last year, matching October's annual rate, but coming in slightly cooler than the 5.0% increase expected [November jobs report: Payrolls grew by 210,000, unemployment rate falls to 4.2%, by Emily McCormick, Yahoo News, December 3, 2021].
But inflation is erasing most, if not all, of the nominal wage gains. The government's latest report on personal consumption prices (it is for October) showed an increase of 4.1%, year-over-year—the most in three decades.
A more detailed picture of how native-born American workers have fared vis-à-vis immigrants is published in Table A-7 of the monthly BLS Report:
|
|
Employment Status by Nativity, Nov.2020-Nov.2021
|
|
|
|
(numbers in 1000s; not seasonally adjusted)
|
|
|
|
|
Nov-20
|
Nov-21
|
Change
|
% Change
|
|
|
|
|
Foreign born, 16 years and older
|
|
|
|
Civilian population
|
42,730
|
44,048
|
1,318
|
3.08%
|
|
|
|
Civilian labor force
|
27,494
|
28,895
|
1,401
|
5.10%
|
|
|
|
Participation rate (%)
|
64.3
|
65.6
|
1.3%pts.
|
2.02%
|
|
|
|
Employed
|
25,644
|
27,853
|
2,209
|
8.61%
|
|
|
|
Employment/population (%)
|
60.0
|
63.2
|
3.2%pts.
|
5.33%
|
|
|
|
Unemployed
|
1,850
|
1,043
|
-807
|
-43.62%
|
|
|
|
Unemployment rate (%)
|
6.7
|
3.6
|
-3.1%pts
|
-46.27%
|
|
|
|
Not in labor force
|
15,236
|
15,152
|
-84
|
-0.55%
|
|
|
|
|
Native born, 16 years and older
|
|
|
|
Civilian population
|
218,355
|
217,981
|
-374
|
-0.17%
|
|
|
|
Civilian labor force
|
132,973
|
133,204
|
231
|
0.17%
|
|
|
|
Participation rate (%)
|
60.9
|
61.1
|
0.2%pts.
|
0.33%
|
|
|
|
Employed
|
124,559
|
127,944
|
3,385
|
2.72%
|
|
|
|
Employment/population (%)
|
57.0
|
58.7
|
1.7%pts.
|
2.98%
|
|
|
|
Unemployed
|
8,414
|
5,260
|
-3,154
|
-37.49%
|
|
|
|
Unemployment rate (%)
|
6.3
|
3.9
|
-2.4%pts
|
-38.10%
|
|
|
|
Not in labor force
|
85,381
|
84,777
|
-604
|
-0.71%
|
|
|
|
Source: BLS, The Employment Situation, November 2021. Table A-7, December 3, 2021. http://www.bls.gov/news.release/pdf/empsit.pdf
|
|
| |
| |
|
|
|
|
|
|
From November 2020 to November 2021:
- Immigrant employment rose by 2.209 million, an eye-popping 8.61%, while native-born employment rose by 3.385 million, a 2.72% gain. ADVANTAGE IMMIGRANTS
- Once again, native-born and foreign-born adult populations moved in different directions. The immigrant adult population rose by 1.318 million, Y-O-Y, a gain of 3.08%, while the corresponding native-born population fell by 374,000—a 0.17% decline, Y-O-Y. ADVANTAGE IMMIGRANTS.
- The immigrant labor force (people working or looking for work) grew 5.1%, a whopping 30 times the 0.17% growth of the native-born labor force. ADVANTAGE IMMIGRANTS (Some commentators note that the Household Survey is better at counting people who found jobs in small businesses after losing payroll jobs in the pandemic, and that this may explain part of the burgeoning labor-force gap between immigrants and native-born.)
- Labor Force Participation Rates rose for both native-born and immigrants, but the 1.3 point (or 2.02%) gain for immigrants dwarfed the 0.2 point (or 0.33%) gain for native-born Americans. While immigrant LPRs have historically been above those of native-born LPRs, the gap grew over the past year, from 3.4% points in November 2020 to 4.5% points this November. ADVANTAGE IMMIGRANTS
- For most of the pandemic unemployment rates were higher for immigrants than native-born. There are many reasons for this, foremost among them: the low-wage jobs filled disproportionately by immigrants preclude remote employment. But in November 2021 the immigrant unemployment rate (3.6%) slipped below that of native-born (3.9%). ADVANTAGE IMMIGRANTS
- 5.26 million native-born, and 1.04 million immigrants, were unemployed in November; over the past 12 months the number of unemployed immigrants fell by 43.6%, while native-born jobless declined by 37.5% ADVANTAGE IMMIGRANTS
The ambiguous BLS employment data muddles the calculations of Federal policymakers weighing whether to shift their focus from creating jobs to reining in prices. It is a complication for a White House trying to show the success of its economic course. And it offers little guidance to businesses about what to expect in the months ahead.
There is no shortage of spin doctors. Biden supporters see “silver linings” in the dismal Payroll Survey job creation number, to wit: employers are too busy looking for workers to respond to the survey. (To be sure, in recent months there has been an abnormal number of “upward revisions” to the payroll numbers. But this does not affect displacement.)
Much has changed since Alan Greenspan (Federal Reserve Chairman 1987-2006) anointed the Payroll Survey as the most dependable of the two surveys back in the 1980s. Job growth is no longer the exclusive province of big business. Mom and Pop is making a big comeback in this pandemic, a trend which, if it persists, could elevate what we have long called the “Other” survey—the one where worker nativity is recorded—to simply “the” survey.
No longer will policymakers have an excuse to ignore the invasion.
Peter Brimelow [Email him] is the editor of VDARE.com. His best-selling book, Alien Nation: Common Sense About America’s Immigration Disaster, is now available in Kindle format.