[Research by Edwin S. Rubenstein]
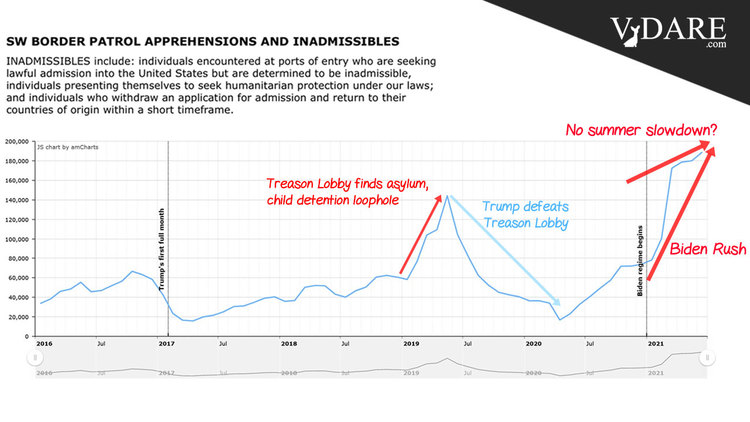
In a telling bit of guilty news management, the Biden Regime held back June's disastrous Border Patrol data for an unprecedented two weeks and finally released it only late Friday afternoon, June 16, when U.S. a.k.a New York City media executives are headed to the Hamptons. Of course they would have buried it anyway[Only 2 Networks (Barely) Mention New Record in Border Crisis, All Skip Hunter Biden Scoop, By Tim Graham, Newsbusters, July 17, 2021]. But at least the border news still got more attention than an even more ominous development: Immigrant Displacement of American Workers and the Immigrant Workforce Population are rising once again.
The Border Patrol data was particularly embarrassing because Biden had claimed the surge was seasonal [Nearly 190,000 border crossings seen in June, busts Biden’s claim it's seasonal, by Paul Bedard, Washington Free Beacon, July 14, 2021]
But in fact, it appears to be showing unprecedented strength.
The June jobs data released earlier this month showed U.S. economy added 850,000 jobs in June, above expectations of 720,000 and an upwardly revised 583,000 in May.
But, paradoxically, the unemployment rate also rose—to 5.9% from 5.8% in June, as the U.S. labor force fell by nearly 900,000 and the Labor Force Participation rate remained stable despite a record number of unfilled positions.
Although Democrat outlets heralded the report, they admitted that “the number is probably not robust enough to change the view of Federal Reserve Chair Jerome Powell that the economy continues to require emergency assistance in the form of rock-bottom interest rates until the labor market heals even further” [U.S. job gains surge, easing pressure on Biden over labor market, by Ben White and Rebecca Rainey, Politico, July 2, 2021]
This is an unprecedented moment for the U.S. labor market, because of massive government transfer payments to American workers displaced because of COVID. Frankly, it throws doubt on any data. Unemployment is high, but companies are complaining they cannot find enough workers. Prices are shooting up for some goods but not for others. A variety of indicators that traditionally moved more or less in tandem are telling widely different stories about the state of the economy.
There is also glaring uncertainty regarding the job numbers for the current month. In a month when the Payroll Survey reported a 850,000 job gain, the “other” employment survey,” of Households rather than businesses, reported a job loss of 18,000. This is the survey that we think captures the employment of illegal aliens, so this is puzzling.
But more troubling than the border crisis in terms of macroeconomic policy: by our calculations, June marked the end of a three-month period during which native-born Americans gained jobs while immigrants lost them.
In June:
- Immigrants (legal and illegal) gained 180,000 jobs, a 0.7% increase from May.
- Native-born Americans lost 198,000 positions, a 0.16% decline from May.
- Thus VDARE.com’s immigrant employment index, set at 100.0 in January 2009, rose to 119.8 in June from 119.0 in May, a 0.7% increase
- VDARE.com’s Native-Born employment index fell to 104.2 from 104.4 in May, a 0.16% decline
This means that the New VDARE American Worker Displacement Index (NVDAWDI), our name for the ratio of immigrant to native-born employment growth indexes since Jan. 2009, rose to 115.0 from 114.0 in May, a 0.9% increase.
Note that this means American Worker Displacement is still at a slightly lower level than it was when Donald Trump was inaugurated in January 2017. After wild gyrations during his Administration, it finally fell, partly because of the pandemic and partly because of his Executive Actions. Perhaps this is his legacy.
Also troubling: the year-over-year rise in the foreign-born working-age population expanded in June for the seventh straight month:
Note carefully what this chart shows. Unlike our other charts, which show absolute values, this one compares each month to the same month of the prior year. So the immigrant workforce population was actually surging by 598,000 in June 2021 compared to June 2020. The corresponding surges for April and May were 542,000 and 373,000, respectively. Now the influx is accelerating.
And note that, for most of 2020, Trump’s last year, the population of working-age immigrants declined year-over-year. This far exceeded the net exodus during the 2008 Great Recession, and the brief net exodus during Trump’s first year, when his mere arrival seems to have jawboned illegals into fleeing.(Sigh!)
The immigrant Work Force population started growing again only in December 2020—when the election results spurred a renewed invasion.
Its full effect on displacement and wage rates have yet to be felt.
Another displacement metric—the immigrant share of total employment—also rose in June. Our analysis shows 17.11% of jobs last month were held by immigrants—above May’s 16.99% and April’s 17.07%. In June 2020 immigrants held 16.24% of all jobs.
Note that, after some gyrations, the immigrant share of employment had been falling steadily even before the pandemic started.
But, again, the Trump gains have been wiped out and the immigrant share is resuming its Obama-Era upward march.
Each 1% rise in immigrant employment share represents a transfer of about 1.5 million jobs from native-born Americans to immigrants.
A more detailed picture of how American workers have fared vis-à-vis immigrants is published in Table A-7 of the monthly BLS Report:
|
Employment Status by Nativity, June 2020-June 2021
|
|
(numbers in 1000s; not seasonally adjusted)
|
| |
Jun-20
|
Jun-21
|
Change
|
% Change
|
| |
Foreign born, 16 years and older
|
|
Civilian population
|
42,198
|
42,796
|
598
|
1.42%
|
|
Civilian labor force
|
26,823
|
27,653
|
830
|
3.09%
|
|
Participation rate (%)
|
63.6
|
64.6
|
1.0%pts.
|
1.57%
|
|
Employed
|
23,130
|
26,059
|
2,929
|
12.66%
|
|
Employment/population (%)
|
54.8
|
60.9
|
6.1%pts.
|
11.13%
|
|
Unemployed
|
3,693
|
1,594
|
-2,099
|
-56.84%
|
|
Unemployment rate (%)
|
13.8
|
5.8
|
-8.0%pts.
|
-57.97%
|
|
Not in labor force
|
15,374
|
15,143
|
-231
|
-1.50%
|
|
|
Native born, 16 years and older
|
|
Civilian population
|
218,007
|
218,542
|
535
|
0.25%
|
|
Civilian labor force
|
134,060
|
134,514
|
454
|
0.34%
|
|
Participation rate (%)
|
61.5
|
61.6
|
0.1%pts.
|
0.16%
|
|
Employed
|
119,681
|
126,224
|
6,543
|
5.47%
|
|
Employment/population (%)
|
54.9
|
57.8
|
2.9%pts.
|
5.28%
|
|
Unemployed
|
14,379
|
8,290
|
-6,089
|
-42.35%
|
|
Unemployment rate (%)
|
10.7
|
6.2
|
-4.5%pts.
|
-42.06%
|
|
Not in labor force
|
83,947
|
84,028
|
81
|
0.10%
|
|
Source: BLS, The Employment Situation, June 2021. Table A-7, July 2, 2021.
|
|
PDF
|
From June 2020 to June 2021:
- The immigrant working age population rose by 598,000, a gain of 1.42%; the native-born population rose by 535,000—a rise of 0.25% over that period. ADVANTAGE IMMIGRANTS, AS THEIR POPULATION OF WORKING AGE GREW NEARLY 6.0-TIMES FASTER THAN THAT OF NATIVE-BORN AMERICANS.
- Immigrants gained 3.4 million jobs—a 15% gain; native-born American workers gained 11 million, a gain of 9.5% over this period. ADVANTAGE IMMIGRANTS
- The immigrant civilian labor force (working or looking for work) rose by 830,000, or 3.1%; the native-born American labor force rose by a mere 454,000, or 0.34%. ADVANTAGE IMMIGRANTS
- Labor Force Participation Rates (LPR) rose for both immigrants and native-born American workers. However, the rise in LPR for native-born Americans over the past 12 months 0.16% is considerably below that of immigrants (1.57%. ADVANTAGE IMMIGRANTS.
The current situation may have reflected work disincentives of unemployment insurance and other social safety-net programs that, in most of the country, are still more easily obtained by native-born Americans than immigrants. Early retirement may also play a role, with “most of the early retirements occurring among lower income workers [immigrants?] who were displaced by the pandemic and see little route back into the job market,” according to Teresa Ghilarducci, a professor of economics and policy analysis at the New School for Social Research in New York City[The pandemic forced millions of Americans to leave the work force earlier than planned. by Nelson D. Schwartz and Coral Murphy Marcos, NYT, July 2, 2021 ].
(Typically, Ghilarducci’s data does not identify the nativity of early retirees).
- The unemployment rate for native-born Americans fell from 10.7% to 5.5%, a 42.1% reduction; the immigrant unemployment rate fell from 13.8% to 5.8% - a 58% reduction. ADVANTAGE IMMIGRANTS, THOUGH UNEMPLOYMENT RATES FOR BOTH ARE WELL ABOVE PRE-PANDEMIC LEVELS.
- 8.3 million native-born, and 1.6 million immigrants, were unemployed in June; over the past 12 months the number of unemployed immigrants fell by 57%, while native-born jobless declined by 52.4% ADVANTAGE IMMIGRANTS
So immigrant displacement of American workers appears to be resuming. Not as fast as we would have expected, given that Americans are frozen in place by transfer payments and immigrants are typically more mobile.
But, to quote Stein’s Law, things that can’t go on, don’t.
Expect to see dramatic American worker displacement soon.
Peter Brimelow [Email him] is the editor of VDARE.com. His best-selling book, Alien Nation: Common Sense About America’s Immigration Disaster, is now available in Kindle format.