Earlier: NATIONAL DATA: In September Jobs Armageddon, Immigrants Gain, Americans Lose; Displacement Hits All-Time High
[Research by Edwin S. Rubenstein]
October’s jobs report, released last Friday, was even more disastrous than September’s, which we described as “Armageddon.” The Ruling Class/ Regime Media is simply delusional about this, because it utterly refuses to factor in immigration (legal and illegal, federal data does not distinguish). Hence Reuters wrote grumpily about the Democrats’ mid-term elections prospects:
[T]here is a roaring, real-time dissonance between the president’s 40% approval rating and broader economic conditions that are at worst mixed—with high inflation top of mind for many but also one of the strongest jobs markets in decades and a 3.7% unemployment rate.
[No-boom, no-bust economy dogs Democrats in U.S. midterm elections, by Howard Schneider, Reuters, November 7, 2022]
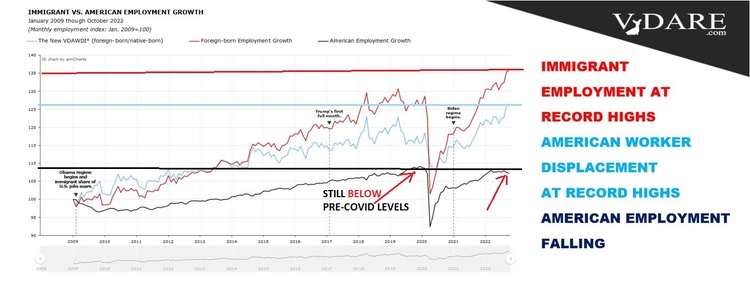
BUNK! The unreported fact is that immigrants took ALL October’s new jobs—and more: American-born employment actually fell (again): aka there really was displacement, partly driven by the Biden Rush at the southern border, and it is now really biting.
For that matter, the October jobs report also noted that average hourly earnings rose by 0.4% for the month, and a much-touted 4.7% year-over-year. But that rise has been far outstripped by inflation—the consensus forecast is that the Consumer Price Index, to be released Thursday, November 10, will show a 7.9% year-over-year increase [October CPI may solidify case for a terminal rate above 5%: What to know this week, by Alexandra Semenova, Yahoo Finance, November 6, 2022].That means inflation-adjusted real wages, which determine what Americans can actually buy, are falling like a rock.
A generation of financial journalists—and economists—is apparently unused to this nuance. But it might be really upsetting to people out there in America-land.
The jobs report shows that employers added 261,000 people to their payrolls last month, which was significantly above the 195,000 expected by Wall Street economists. Employment growth has moderated in recent months, but the risk of an overly hawkish Fed sending the economy into a tailspin grows greater by the day.
Hey, Fed guys. Has anyone checked out the “other” employment survey, of households rather than businesses?
Our analysis of the October Household Survey finds 328,000 jobs disappeared last month. Employment actually fell. This is often viewed as a leading indicator of recession. Native-born were the biggest losers. Immigrants actually gained slightly.
In OCTOBER:
- Immigrants (legal and illegal) gained 15,000 jobs, a 0.05% gain from September.
- Native-born Americans lost 343,000 positions, a 0.26% decline.
- Thus VDARE.com’s immigrant employment index, set at 100.0 in January 2009, rose to 135.6 from 135.5 in September, a 0.05% increase.
- VDARE.com’s American Native-Born employment index declined to 107.2 from 107.5, a 0.26% reduction from September.
Bottom line: The New VDARE American Worker Displacement Index (NVDAWDI), our name for the ratio of the immigrant to native-born American employment growth indexes since January 2009, rose to a record 126.5 in October, up from the previous record (126.1) just set in September.
Despite 1.008 million immigrants reported as unemployed in October, the foreign-born working-age population expanded by 2.459 million, year-over-year. This was the largest year-over-year rise since we began tracking the foreign-born working-age population in January 2009, and the fifth month in the last six in which the immigrant adult population grew more than 2 million, year-over-year.
Never over the past 15 years has the immigrant working-age population expanded this much, for this long:
Note carefully what this chart shows. Unlike our other charts, which show absolute values, this one compares each month to the same month of the prior year. So the immigrant workforce population grew by 2.459 million in October compared to October 2021. The corresponding increases for August and September were 1.970 million and 2.240 million, respectively.
For most of 2020, the population of working-age immigrants declined year-over-year. This far exceeded the net exodus during the 2008 Great Recession, and the brief net exodus during Trump’s first year, when his mere presence seemed to have jawboned illegals into fleeing.
The immigrant population of working age started growing again only in December 2020—when the election results spurred a renewed invasion.
Another displacement metric—the immigrant share of total employment—hit a record 18.506% in October, the highest since we started tracking employment by nativity in January 2009. In June of this year 17.847% of jobs were held by immigrants.
The Household Survey reported 158.6 million people held jobs in the U.S. Each 1% rise in immigrant employment share represents a transfer of about 1.586 million jobs from native-born Americans to immigrants.
As far as total employment is concerned, Household Survey figures are invariably above Payroll Survey figures. One likely explanation: U.S. businesses are reluctant to acknowledge illegals working “off the books.” In October, the employment “gap” between the surveys fell to 5.3 million, down from September’s 5.918 million.
A more detailed picture of how native-born American workers fared over the past year vis-à-vis immigrants is published in Table A-7 of the monthly BLS Report:
|
Employment Status by Nativity, Oct.2021-Oct. 2022
|
|
(numbers in 1000s; not seasonally adjusted)
|
|
|
Oct-21
|
Oct-22
|
Change
|
% Change
|
|
|
Foreign born, 16 years and older
|
|
Civilian population
|
43,449
|
45,908
|
2,459
|
5.66%
|
|
Civilian labor force
|
28,564
|
30,459
|
1,895
|
6.63%
|
|
Participation rate (%)
|
65.7
|
66.3
|
1.4
|
2.13%
|
|
Employed
|
27,341
|
29,451
|
2,110
|
7.72%
|
|
Employment/population (%)
|
62.9
|
64.2
|
1.3
|
2.07%
|
|
Unemployed
|
1,224
|
1,008
|
-216
|
-17.65%
|
|
Unemployment rate (%)
|
4.3
|
3.3
|
-1.0
|
-23.26%
|
|
Not in labor force
|
14,885
|
15,450
|
565
|
3.80%
|
|
|
Native born, 16 years and older
|
|
Civilian population
|
218,458
|
218,627
|
169
|
0.08%
|
|
Civilian labor force
|
133,298
|
134,294
|
996
|
0.75%
|
|
Participation rate (%)
|
61
|
61.4
|
0.4
|
0.66%
|
|
Employed
|
127,626
|
129,693
|
2,067
|
1.62%
|
|
Employment/population (%)
|
58.4
|
59.3
|
0.9
|
1.54%
|
|
Unemployed
|
5,673
|
4,601
|
-1,072
|
-18.90%
|
|
Unemployment rate (%)
|
4.3
|
3.4
|
-0.9
|
-20.93%
|
|
Not in labor force
|
85,160
|
84,333
|
-827
|
-0.97%
|
|
Source: BLS, The Employment Situation, October 2022. Table A-7, November 4, 2022. http://www.bls.gov/news.release/pdf/empsit.pdf
|
From October 2021 to October 2022:
- Immigrant employment rose by 2.110 million, an eye-popping 7.72%, while native-born American employment rose 2.087 million, a 1.62% gain. ADVANTAGE IMMIGRANTS
- The immigrant population of working-age rose by 2.459 million, a gain of 5.66%, year-over-year, while the corresponding native-born American population increased by 169,000—a 0.08% rise. THE IMMIGRANT ADULT POPULATION GREW 70.8 TIMES FASTER THAN THE NATIVE-BORN AMERICAN ADULT POPULATION. ADVANTAGE IMMIGRANTS
- The immigrant labor force (people working or looking for work) grew by 6.63%, 8.8 times the 0.75% gain in the native-born labor force. ADVANTAGE IMMIGRANTS (The data in the table are from a survey of households, which includes self-employed workers, agricultural workers, and private family workers, who are excluded from the more widely cited Payroll Survey. Also overlooked, we contend, are illegal immigrants working “off the books” in large corporations.)
- Labor Force Participation Rates rose for both native-born and immigrants. However, the 1.4% point (2.13%) gain for immigrants was 3.2 times larger than the 0.4% percentage point (0.66%) gain for native-born workers. ADVANTAGE IMMIGRANTS
- The unemployment rate for native-born American workers fell by 0.9 percentage points, or 20.9%, while the immigrant unemployment rate fell by 1.0 % points, or 23.3%. ADVANTAGE IMMIGRANTS
- 4.601 million native-born Americans, and 1.008 million immigrants, were unemployed in October; over the prior 12 months the number of unemployed immigrants fell by 17.7%, while native-born American jobless declined by 18.9%. ADVANTAGE NATIVE-BORN AMERICANS (slightly)
The juxtaposition of rampant inflation and wilting employment numbers reportedly caused Fed Chairman Jay Powell to feel that the “…slight moderations in the data were not enough for a pause on increases given the tight labor condition” [Jobs report: U.S. payrolls grew by 261,000 in October, unemployment rate rises to 3.7%, by Alexandra Semenova, Yahoo Finance, November 6, 2022].
Left unsaid by Powell: the record influx of foreign-born workers could alleviate labor market tightness—albeit at a high cost to native-born American workers.
Of course, inflation is ultimately a monetary phenomenon and massive imports of immigrants will not bring down the overall price level any more than debauching the Strategic Petroleum Reserve is doing—but it could reduce specific prices for key constituents, aka GOP donors.
Watch out for this in the lame-duck Congress.
Peter Brimelow [Email him] is the editor of VDARE.com. His best-selling book, Alien Nation: Common Sense About America’s Immigration Disaster, is now available in Kindle format.