[Research by Edwin S. Rubenstein]
Joe Biden’s casual comment about the possibility of a nuclear Armageddon [Joe Biden, At Midterm Fundraiser At Home Of James Murdoch, Talks Of Vladimir Putin’s Nuclear Threat: Biggest Risk Of “Armageddon” Since Cuban Missile Crisis, Deadline, October 5, 2022] got weirdly little attention—but at least it got more than another Armageddon that has already happened: immigrant displacement of American workers, building relentlessly throughout his time in office, has now decisively broken out to an all-time high.
Recently, I’ve been holding back National Data columns until after the inflation data is released mid-month and after the border crossing data (which used to be released early in the month, and has now become ludicrously late, in a blatant effort to minimize coverage). But September’s displacement is too big a story. It means that the Regime Media spin [Unemployment rate falls to 3.5% in September, payrolls rise by 263,000 as job market stays strong, by Jeff Cox, CNBC, October 7, 2022] is no longer a lie: it is a scandal.
The Payroll Survey, released last Friday October 7, showed employers adding 263,000 people to their payrolls in September, down significantly from August’s 315,000 gain, and off massively from the 526,000 hired in July.
We are in a peculiar place where good news in the job market is bad news for stock market investors and the U.S. central bank, because it is thought to imply continued inflation. The jobs slowdown was considered not bad enough. Further Fed rate hikes are now widely expected.
The “other” jobs survey, of Households rather than employers, was also released last Friday. Our analysis finds that only 204,000 jobs were created last month and immigrants (legal and illegal, federal data does not distinguish) gaining positions while native-born Americans lost them. The same survey in August found 442,000 jobs were created.
So in September:
- Immigrants (legal and illegal) gained 681,000 jobs, a 2.38% gain from August
- Native-born Americans lost 477,000 positions, a 0.37% decline from August.
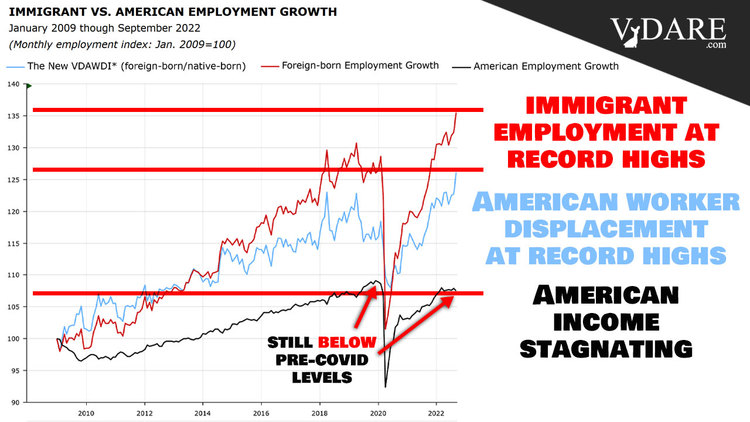
- Thus VDARE.com’s immigrant employment index, set at 100.0 in January 2009, rose to 135.5 from 132.4 in July, a 2.34% increase.
- VDARE com’s native-born American employment index declined last month, to 107.5 from 107.9 in August, a 0.37% reduction.
Thus the New VDARE American Worker Displacement Index (NVDAWDI), our name for the ratio of the immigrant to native-born American employment growth indexes since Jan. 2009, soared to a record 126.1 in September from 122.7 in August, a hefty 2.75% increase.
The previous record NVDAWDI—123.0—was set in May.
Despite 864,000 immigrants reported as unemployed in September, the foreign-born working-age population expanded by 2.240 million, year-over-year. It was the fourth month in the last five that the immigrant population grew more than two million, year-over-year.
Never over the past 15 years has the immigrant working-age population expanded this much, for this long:
Note carefully what this chart shows. Unlike our other charts, which show absolute values, this one compares each month to the same month of the prior year. So the immigrant workforce population grew by 2.240 million in September compared to September 2021. The corresponding increases for July and August were 2.038 million, and 1.978 million, respectively.
For most of 2020, the population of working-age immigrants declined Y-O-Y. This far exceeded the net exodus during the 2008 Great Recession, and the brief net exodus during Trump’s first year, when his mere presence seemed to have jawboned illegals into fleeing.
The immigrant population of working age started growing again only in December 2020—when the election results spurred a renewed invasion.
Obviously, this immigrant workforce growth far exceeds employment growth. It must eventually feed through into American worker displacement and lower wages. That this is happening is now undeniable.
Another displacement metric—the immigrant share of total employment—hit a record 18.458% in September. Again, this the highest since we started tracking employment by nativity in January 2009, when the Household Survey began reporting it. In June of this year 17.847% of jobs were held by immigrants.
The September Household Survey reported 158.7 million people held jobs in the U.S. Each 1% rise in immigrant employment share represents a transfer of about 1.587 million jobs from native-born Americans to immigrants
As far as total employment is concerned, Household Survey figures are invariably above Payroll Survey figures. One likely explanation: U.S. businesses are reluctant to acknowledge illegals working “off the books.” In September the employment “gap” between the surveys fell to 5.918 million, down by 0.7% from August’s 5.958 million.
A more detailed picture of how native-born American workers fared over the past year vis-à-vis immigrants is published in Table A-7 of the monthly BLS Report:
|
Employment Status by Nativity, Sept.2021-Sept. 2022
|
|
(numbers in 1000s; not seasonally adjusted)
|
|
|
Sep-21
|
Sep-22
|
Change
|
% Change
|
|
|
Foreign born, 16 years and older
|
|
Civilian population
|
43,111
|
45,351
|
2,240
|
5.20%
|
|
Civilian labor force
|
28,100
|
30,213
|
2,113
|
7.52%
|
|
Participation rate (%)
|
65.2
|
66.6
|
1.4 %pts.
|
2.15%
|
|
Employed
|
26,816
|
29,349
|
2,533
|
9.45%
|
|
Employment/population (%)
|
62.2
|
64.7
|
2.5 %pts.
|
4.02%
|
|
Unemployed
|
1,284
|
864
|
-420
|
-32.71%
|
|
Unemployment rate (%)
|
4.6
|
2.9
|
-1.7 %pts.
|
-36.96%
|
|
Not in labor force
|
15,012
|
15,138
|
126
|
0.84%
|
|
|
Native born, 16 years and older
|
|
Civilian population
|
218,654
|
219,005
|
351
|
0.16%
|
|
Civilian labor force
|
133,293
|
134,250
|
957
|
0.72%
|
|
Participation rate (%)
|
61.0
|
61.3
|
0.3%pts.
|
0.49%
|
|
Employed
|
127,210
|
129,654
|
2,444
|
1.92%
|
|
Employment/population (%)
|
58.2
|
59.2
|
1.0 %pts.
|
1.72%
|
|
Unemployed
|
6,083
|
4,596
|
-1,487
|
-24.45%
|
|
Unemployment rate (%)
|
4.6
|
3.4
|
-1.2 %pts.
|
-26.09%
|
|
Not in labor force
|
85,362
|
84,755
|
-607
|
-0.71%
|
|
Source: BLS, The Employment Situation, September 2022. Table A-7, October 7, 2022. PDF
|
From September 2021 to September 2022:
- Immigrant employment rose by 2.533 million, an eye-popping 9.45%, while native-born employment rose 2.444 million, a 1.92% gain. ADVANTAGE IMMIGRANTS
- The immigrant population of working-age rose by 2.240 million, a gain of 5.20%, Y-O-Y, while the corresponding native-born population increased by 351,000—an 0.16% rise. THE IMMIGRANT ADULT POPULATION GREW 325-TIMES FASTER THAN THE NATIVE-BORN ADULT POPULATION. ADVANTAGE IMMIGRANTS
- The immigrant labor force (people working or looking for work) grew by 7.52%, 10.4-times the 0.72% gain in the native-born labor force. ADVANTAGE IMMIGRANTS
The data in the table are from a survey of households, which includes self-employed workers, agricultural workers, and private family workers, who are excluded from the more widely cited Payroll Survey. Also overlooked, we contend, are illegal immigrants working “off the books” in large corporations.
- Labor Force Participation Rates rose for both native-born and immigrants; however, the 1.4-point (2.15%) gain for immigrants was 4.4 times larger than the 0.3-point (0.49%) gain for native-born American workers. ADVANTAGE IMMIGRANTS
- The unemployment rate for native-born workers fell by 1.2 percentage points, or 26.1%, while the immigrant unemployment rate fell by 1.7 %points, or 37%. ADVANTAGE IMMIGRANTS
- 4.596 million native-born, and 864,000 immigrants, were unemployed in SEPTEMBER; over the prior 12 months the number of unemployed immigrants fell by 32.7%, while native-born jobless declined by 24.5%. ADVANTAGE IMMIGRANTS
The big picture: Despite the drop-off in jobs added in September, the unemployment rate fell to 3.5%; most economists expected it to hold at 3.7%. The labor force participation rate ticked down slightly, to 62.3% from 62.4%.
Average hourly earnings rose 5.0% year-over-year, in September. In most years that would be a stellar achievement. But with CPI up by 8.3% year-over-year in August (latest available reading), it means real, i.e., inflation adjusted wages are falling sharply.
Astonishingly, President Biden commented on the jobs data that “Wage growth for workers remains solid, down from the historic high pace months ago but still growing for workers who deserve a raise” [ Remarks by President Biden on the Economy and the September Jobs Report, October 7, 2022]. This is too flagrant to be a lie: it appears that he just doesn’t know.
Investors and markets increasingly believe the Fed is closer to the beginning than the end of its tightening cycle. A recession—possibly prolonged—seems ever more likely.
But for American workers, Armageddon has already begun.
Peter Brimelow [Email him] is the editor of VDARE.com. His best-selling book, Alien Nation: Common Sense About America’s Immigration Disaster, is now available in Kindle format.