From a distance the latest job report seems idyllic—a moment of Zen. Payrolls increased by 215,000 in March, above expectations, while
February’s stellar 242,000 job gain which many thought was unsustainable, was revised upward—upward! Average hourly earnings increased rose by 0.3%.
Even the one ostensibly bad piece of news—a rise in the unemployment rate—had a silver lining. Unemployment rose from 4.9% to 5.0% in March because more people returned to the labor force, a sign of confidence in the labor market.
The devil was in the details—inconvenient details found only in the Household Employment Survey. March’s employment gain, 246,000 per the Household Survey, was even greater the Payroll Survey figure, the job gains went entirely to foreign-born workers a.k.a. legal and illegal immigrants
In March 2016:
- Total Household Survey employment rose 246,000, up by 0.2%
- “Native-born”—American—employment fell by 32,000, down by 0.03%
- “Foreign-born”—immigrant—employment rose by 278,000, up by 1.1%
Look at the March job data and you begin to understand why the “strong” job market of the past few years have done little to assuage the economic stress and anger of the
average American – emotions that fuel the candidacy of
Donald Trump (and, perhaps, Ted Cruz). We are seeing an increasingly bifurcated labor market: robust demand for
low-wage hospitality and service workers, where immigrant workers are over-represented, keeping the total job count up; manufacturing, transportation and energy sectors, dominated by blue collar white men, losing ground.
Manufacturing was the biggest loser in March, shedding 29,000 jobs. NAFTA and other trade agreements—deals that Trump has pledged to rescind—are unquestionably a major reason.
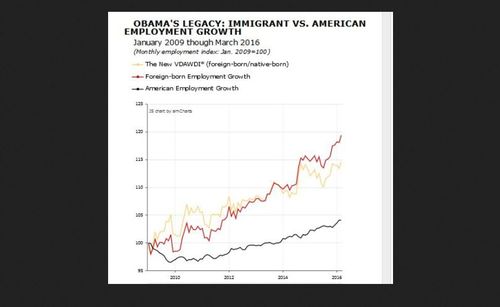
American workers have lost ground to their immigrant competitors throughout the Obama years. We highlight this trend in our New VDARE.com American Worker Displacement Index (NVDAWDI) graphic:
Native-born American employment growth is represented by the black line, immigrant employment growth is in pink, and NVAWDI—the ratio of immigrant to native-born job growth—is in yellow. The index starts at 100.0 in January 2009 for both immigrants and native-born Americans, and tracks their employment growth since then.
From January 2009 through March 2016:
- Foreign-born immigrant employment rose by 4.104 million, up 19.4%. The immigrant employment index rose from 100.0 to 119.4.
- Native-born American employment rose by 4.905 million or by 4.1%. The native-born American employment index rose from 100.0 to 104.1
- NVDAWDI (the ratio of immigrant to native-born employment growth indexes) rose from 100.0 to 114.7. (100X (119.4/104.1))
During the Obama years immigrant employment has risen 4.7-times faster than
native-born American employment—9.4% versus 4.1%. In many unskilled occupations the job growth gap is far larger, owing to the
disproportionate number of foreign-born workers.
The foreign-born share of total U.S. employment has risen steadily, albeit erratically, throughout the Obama years:
In February 2009, President Obama’s first full month in office, 14.972% of all persons working in the U.S. were foreign-born. In March 2016 the foreign-born share was a record 17.077%.
That was up from February’s 16.920%, and also above the 16.891% recorded in March 2015. (Since employment data by nativity is not seasonally adjusted, comparisons with the same month last year may be more indicative of the real trend.)
Obama has been President for 87 months. But in none of those months have immigrants held a larger share of jobs than they did last month.
March’s immigrant employment share was a full 2.105 percentage points above the level recorded at the start of Mr. Obama’s administration. With total employment now at 151.3 million, each percentage point translates to 1.51 million workers. Implication: Obama-era immigration may have pushed as many as 3.18 million (1.51 million times 2.105) native-born Americans onto the unemployment rolls.
A detailed snapshot of American worker displacement over the past year is seen in the “Employment Status of the civilian population by nativity” table published in the monthly BLS report:
| Employment Status by Nativity, March 2015-March 2016 |
| (numbers in 1000s; not seasonally adjusted) |
| |
Mar-15 |
Mar-16 |
Change |
% Change |
| |
Foreign born, 16 years and older |
| Civilian population |
40,198 |
41,148 |
950 |
2.4% |
| Civilian labor force |
26,328 |
27,029 |
701 |
2.7% |
| Participation rate (%) |
65.5% |
65.7% |
0.2% |
0.3% |
| Employed |
24,937 |
25,741 |
804 |
3.2% |
| Employment/population % |
62.0% |
62.6% |
0.6% |
1.0% |
| Unemployed |
1,391 |
1,288 |
-103 |
-7.4% |
| Unemployment rate (%) |
5.3% |
4.8% |
-0.5% |
-9.4% |
| Not in labor force |
13,870 |
14,119 |
249 |
1.8% |
|
Native born, 16 years and older |
| Civilian population |
209,882 |
211,620 |
1,738 |
0.8% |
| Civilian labor force |
129,990 |
131,825 |
1,835 |
1.4% |
| Participation rate (%) |
61.9% |
62.3% |
0.4% |
0.6% |
| Employed |
122,698 |
124,997 |
2,299 |
1.9% |
| Employment/population % |
58.5% |
59.1% |
0.6% |
1.0% |
| Unemployed |
7,292 |
6,828 |
-464 |
-6.4% |
| Unemployment rate (%) |
5.6% |
5.2% |
-0.4% |
-7.1% |
| Not in labor force |
79,892 |
79,795 |
-97 |
-0.1% |
| Source: BLS, The Employment Situation - March 2016, Table A-7, April 1, 2016. |
| PDF |
From March 2015 to March 2016:
- Foreign-born employment rose by 804,000 – a 3.2% increase - while native-born employment rose by 2,299,000, – up by 1.9%. Immigrant employment grew 68% faster than native-born American employment
- The number of unemployed immigrants fell by 7.4%, while native-born American unemployed fell by 6.4%. Advantage immigrants
- Unemployment rates dropped 9.4% for immigrants and 7.1% for native-born Americans. Advantage immigrants
- Labor-force participation (LFP) rates, a sign of worker confidence, ROSE for both immigrants and native-born Americans. At 65.7%, the immigrant LPR remains well above that of Americans (62.3%).
The already wide gap in population growth rates got wider last month. Over the past 12 months (March 2015 to March 2016) the foreign-born working-age population increased by 2.4%, while the comparable native-born population grew 0.8%. That is a 3-to-1 population growth rate “advantage” for immigrants – far greater than the 1.6-to-1 “advantage” reported in the previous month’s employment survey
Perhaps more important: the number of working-age immigrants rose by an estimated 950,000 since March 2015. That figure is close to the annual legal immigrant influx of all ages—possibly signaling renewed illegal alien penetration of the labor force, something I have been warning about for a year.
America’s post-1965 immigration disaster may be intensifying.
Edwin S. Rubenstein (email him) is President of ESR Research Economic Consultants.