In the months after Donald Trump’s election, immigrant displacement of American workers and growth of the foreign-born workforce (including illegals) seemed to be
reversing so consistently that we were surprised when April’s job data
suddenly undid all the gains. We wondered if it was
statistical noise. The June jobs data, released Friday, brings good news and bad news. The good news: the immigrant population of working age, while still increasing, is below the estimated legal inflow: June’s net figure – 497,000—is less than one-third the year over year inflows reported for the months prior to the election. This
probably means that a gross
exodus of illegals continues. The bad news: the foreign-born share of total employment rose to 17.2% in June, matching the Obama-era high set in August of last year. Our take: Trump’s strong economy is producing jobs, but the stock of immigrants in the country, as well as the (possibly reduced but still high) net influx, is so large that Americans are still being beaten out in the job market, basically because immigrants are willing to work for less.
MEMO TO TRUMP: WE NEED A WALL, WE NEED E-VERIFY—AND ULTIMATELY WE NEED AN IMMIGRATION MORATORIUM.June saw both employment surveys reach pretty much the same conclusion: Jobs are being created at rates that keep unemployment in the low 4 percent range. The difference between the 245,000-gain reported by the Household Survey and the 220,000 reported by the more-widely-cited Survey of Employers is statistically insignificant, given the random noise that bedevils monthly government surveys.
Note, however, that average wage gains remained anemic, up a mere 0.15% over May, dispelling the notion that there is a shortage of available labor and suggesting a strong immigrant impact.
Once again, the Household Survey data show that immigrants comprise most of the new employees:
In June:
Total employment rose 245,000, up by 0.16%
- Native-born American employment rose 82,000, up by 0.06%
- Foreign-born employment rose 129,000, up by 0.62%
The overall unemployment rate is now 4.4%, up slightly from 4.3% in May. And, as seen below, the seasonally unadjusted unemployment rate for immigrants, 3.7%, is below the 4.7% rate for native-born Americans in June.
More than half—53%—of June’s job gains went to immigrants. By (sharp) contrast, during Trump’s first two months immigrants appeared to be retreating and native-born Americans surging into the job market. During February and March of this year native-born Americans gained 986,000 jobs while immigrants lost 67,000.)
So, for whatever reason, we have not yet decisively reversed the long-term Obama-Era trend. Foreign-born workers held 17.22% of all jobs in June—up from 17.14% in March. Thus June ties the Obama-era record for foreign-born share of total employment set in August 2016. In Trump’s first full month (February) immigrants held 16.95% of jobs.
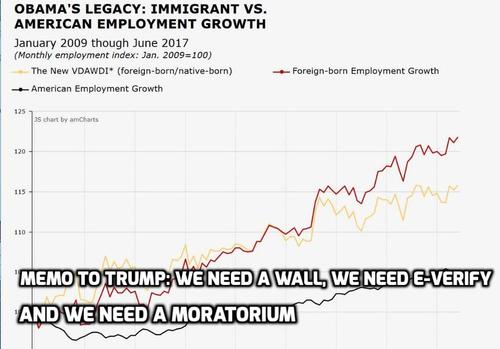
Native-born American workers lost ground to their foreign-born competitors throughout the Obama years, and this trend accelerated significantly in the months leading up to the election. This is brought out in our New VDARE.com American Worker Displacement Index (NVDAWDI) graphic:
Native-born American employment growth is represented by the black line, immigrant employment growth is in pink, and NVAWDI—the ratio of immigrant to native-born American job growth—is in yellow.
The index starts at 100.0 in January 2009 for both immigrants and native-born Americans, and tracks their employment growth since then.
From January 2009 through June 2017:
- Immigrant employment rose by 4.723 million, or by 21.8%. The immigrant employment index rose from 100.0 to 121.8.
- Native-born American employment rose by 6.224 million, up by 5.2%. The native-born American employment index rose from 100.0 to 105.2.
- NVDAWDI (the ratio of immigrant to native-born employment growth indexes) rose from 100.0 to 115.8. (100X (121.8/105.2))
During the 96 months of Barack Obama’s tenure, immigrant employment rose 4.2 times faster than native-born American employment—19.8% versus 4.7%.
With the spring surge in immigrant employment, Trump’s brief tenure is also marked by American worker displacement. From January through June immigrant employment grew nearly three times faster than native-born employment: 1.48% versus 0.56%.
The foreign-born share of total U.S. employment rose steadily, albeit erratically, throughout the Obama years. It fell sharply in the months after the election, but roared back to Obama-era levels in the spring:
In February 2009, Barack Obama’s first full month in office, 14.97% of all persons working in the U.S. were foreign-born. In his last full month, December 2016, 17.05% of workers were foreign-born. This implies that Obama-era immigration pushed as many as 3.16 million native-born Americans onto the unemployment rolls.
The immigrant share of employment in June 2017 (17.22%) was 0.17 percentage points above the share in December, Obama’s last full month. This implies that resistance to Trump’s immigration agenda may have put as many as 26,000 native-born Americans out of work.
In contrast, by early April, the mere threat of a Trump immigration crackdown appeared, by our estimates, to have put 168,000 native-born American workers back to work. This was actually quite plausible, given the early hysteria about Trump in the MSM. Some immigrants, legal and illegal, may have taken it seriously and decided to leave. Others, above all illegals, may have decided not to come after all. [Central Americans, ‘Scared of What’s Happening’ in U.S., Stay Put, By Kirk Semple, NYT, July 3, 2017]
But the atmospherics are more confused now, and the June’s employment situation may reflect that.
A detailed snapshot of American worker displacement over the past year is available in the Employment Status of the Civilian Population by Nativity table published in the monthly BLS Report. [PDF]
| Employment Status by Nativity, June 2016-June 2017 |
| (numbers in 1000s; not seasonally adjusted) |
|
Jun-16 |
Jun-17 |
Change |
% Change |
|
Foreign born, 16 years and older |
| Civilian population |
41,055 |
41,552 |
497 |
1.21% |
| Civilian labor force |
26,936 |
27,540 |
604 |
2.24% |
| Participation rate (%) |
65.6 |
66.3 |
0.7 %pts. |
1.07% |
| Employed |
25,851 |
26,528 |
677 |
2.62% |
| Employment/population % |
63.0 |
63.8 |
0.8 %pts. |
1.27% |
| Unemployed |
1,086 |
1,012 |
-74 |
-6.81% |
| Unemployment rate (%) |
4.0 |
3.7 |
-0.3 %pts. |
-7.50% |
| Not in labor force |
14,119 |
14,012 |
-107 |
-0.76% |
|
Native born, 16 years and older |
| Civilian population |
212,342 |
213,405 |
1,063 |
0.50% |
| Civilian labor force |
133,198 |
133,796 |
598 |
0.45% |
| Participation rate (%) |
62.7 |
62.7 |
0.0 %pts. |
0.00% |
| Employed |
126,140 |
127,558 |
1,418 |
1.12% |
| Employment/population % |
59.4 |
59.8 |
0.4 %pts. |
0.67% |
| Unemployed |
7,058 |
6,238 |
-820 |
-11.62% |
| Unemployment rate (%) |
5.3 |
4.7 |
-0.6 %pts. |
-11.32% |
| Not in labor force |
79,144 |
79,609 |
465 |
0.59% |
| Source: BLS, The Employment Situation- June 2017, Table A-7, July 7, 2017. |
| PDF |
Over the last 12 months (June 2016 to June 2017):
- The foreign-born labor force grew five-times faster than the native-born labor force: 2.24% versus 0.45%. ADVANTAGE IMMIGRANTS
- Immigrant employment rose 2.3-times faster than native-born employment: 2.62% versus 1.12%. ADVANTAGE IMMIGRANTS
- The labor-force participation rate (LPR), a sign of worker confidence, rose by 0.7 points for immigrants and was unchanged for native-born Americans. At 66.3%, the immigrant LPR in June was considerably above the native-born American rate (62.7%.) ADVANTAGE IMMIGRANTS
- The number of unemployed native-born Americans fell by 820,000 – down 11.6%. The number of unemployed immigrants fell 74,000 – down 6.8%. ADVANTAGE AMERICANS, although much of this “advantage” may be due to older natives retiring, or younger, discouraged, natives leaving the labor force from lack of suitable job opportunities.
But the population data does give us a glimmer of hope. From June 2016 to June 2017 the foreign-born working age population rose by just 497,000—which was down from the 697,000 year over-year gain recorded in May. This trend has been down since April. Should this mean the post-election downtrend is reasserting itself, these figures could turn negative in future months—i.e. a net outflow of immigrants, most likely because illegals continue to self-deport :
| Change in Foreign-born population from same month prior year (age 16+; in 1,000s; BLS data) |
| July 2016 |
1,176 |
| Aug. 2016 |
1,478 |
| Sept. 2016 |
1,471 |
| Oct. 2016 |
1,711 |
| Nov. 2016 |
1,545 |
| Dec. 2016 |
886 |
| Jan. 2017 |
351 |
| Feb. 2017 |
177 |
| Mar. 2017 |
56 |
| Apr. 2017 |
770 |
| May 2017 |
697 |
| June 2017 |
497 |
Still more good news: Immigrant working-age population growth in April, May, and June was below the 900,000-1 million figure commonly cited as the annual legal influx of all ages. Prior to the election immigrant workforce growth regularly exceeded estimated legal inflow, evidence of the surge of illegal immigration that occurred in Obama’s last year. The spring slowdown implies that the “Trump effect” is still alive, albeit attenuated.
Of course, the foreign-born are only the tip of the immigration iceberg. The true measure of post-1965 immigration impact on the labor market and population would include their U.S.-born children. My estimate: factoring in U.S.-born children virtually doubles (+ 80%) immigration’s depression of American wages.