Friday’s August job report was greeted with a collective yawn by the Main Stream Media—which as usual paid no attention to immigrant displacement of American workers, which has reached an
Obama-Era high, or to mounting evidence that
illegal immigration is surging.
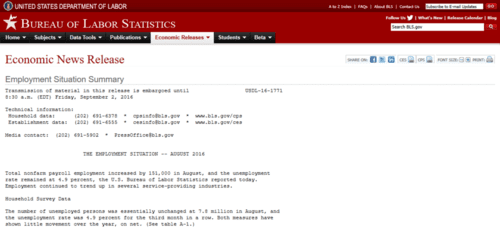
Who cares that businesses added 151,000 jobs, far below the 275,000 added in July, and below what is required to bring the unemployment down. Not to worry: this mediocre job growth reduces the prospect of a Fed interest rate hike.
Wages grew by an anemic 0.1%, well below the growth that was common at this point in prior recoveries? Not to worry: this reduces the prospect of inflation – another positive keeping the Fed at bay.
The Labor force Participation Rate [LPR] remains at a historically low 62.8%? Not to worry: a low LPR means a lot of people are still on the bench and could come into the labor market. These poor folks are a useful dampener against wage and price inflation.
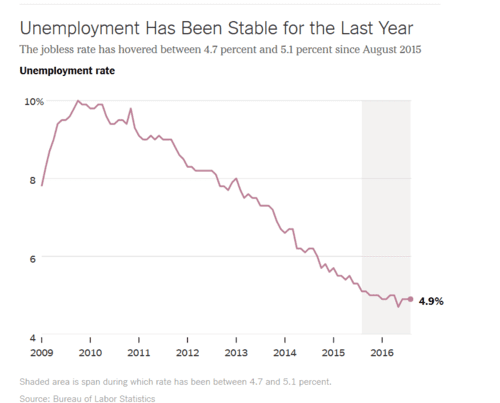
![stable]() “The new August jobs report is a prime example of data that affirms the status quo. And that’s not such a bad thing,” writes Neil Irwin in the New York Times, illustrating it with the chart on the right.[ This Status Quo Jobs Report Shows the Economy Isn’t Overheating, September 2, 2016]
“The new August jobs report is a prime example of data that affirms the status quo. And that’s not such a bad thing,” writes Neil Irwin in the New York Times, illustrating it with the chart on the right.[ This Status Quo Jobs Report Shows the Economy Isn’t Overheating, September 2, 2016]
Not such a bad thing? Maybe for investors. Not for native-born American workers. Unfortunately, neither Mr. Irwin not his MSM counterparts bother with the table in the BLS report where monthly data on the nativity of workers is published. We do.
In August
- Total Household Survey employment rose by 97,000, up by 0.06%
- Native-born American employment fell by 177,000, off by 0.14%
- Foreign-born immigrant employment rose by 274,000, up by 1.06%
While
Native-born workers have
lost ground to their foreign-born competitors throughout the Obama years, the trend has accelerated significantly over the past few months. In fact, the displacement of natives by immigrants hit an Obama-era high in August. This is brought out in our
New VDARE.com American Worker Displacement Index (NVDAWDI) graphic:
Native-born American employment growth is represented by the black line, immigrant employment growth is in pink, and NVAWDI—the ratio of immigrant to native-born job growth—is in yellow. The index starts at 100.0 in January 2009 for both immigrants and native-born Americans, and tracks their employment growth since then.
From January 2009 through August 2016:
- Immigrant employment rose by 4.455 million, or by 20.6%. The immigrant employment index rose from 100.0 to 120.6.
- Native-born American employment rose by 4.938 million, up by 4.1%. The native-born American employment index rose from 100.0 to 104.1.
- NVDAWDI (the ratio of immigrant to native-born employment growth indexes) rose from 100.0 to 115.8. (100X (120.6/104.1))
During the Obama years
immigrant employment has risen 5.0-times faster than American employment – an increase of 20.6% versus one of 4.1%. In many unskilled occupations the job growth gap is far larger, owing to the disproportionate number of foreign-born workers.
The foreign-born share of total U.S. employment has risen steadily, albeit erratically, throughout the Obama years:
In February 2009, President Obama’s first full month in office, 14.972% of all persons working in the U.S. were foreign-born. The foreign-born share in August 2016 was 17.216%, the highest among the 92 months of Mr. Obama’s administration. The prior record, 17.077%, was set in March of this year.
Six of the 10 worst months for native-born workers (measured by the share of jobs held by immigrants) have occurred in 2016.
August’s immigrant employment share was 2.24 percentage points above the level recorded in February 2009, Barack Obama’s first full month in office. With total employment now at 151.6 million, this implies that Obama-era immigration may have pushed as many as 3.63 million native-born Americans onto the unemployment rolls since then.
A detailed snapshot of American worker displacement over the past year is seen in the Employment Status of the Civilian Population by nativity table published in the monthly BLS Report.
![employmentstatus]() Source: BLS, The Employment Situation - August 2016, Table A-7, September 2, 2016. PDF
Source: BLS, The Employment Situation - August 2016, Table A-7, September 2, 2016. PDF
From August 2015 to August 2016:
- Foreign-born employment rose by 1.220 million, up 4.9%, while native-born American employment rose 1.356 million, up by 1.1%. Immigrant employment grew more than 4-times faster than native-born employment.
- The foreign-born labor force rose by 4.9%, the native-born labor force rose by 0.9%. Advantage immigrants.
- The unemployment rate dropped slightly for native-born workers and did not change for immigrants. At 4.4%, however, the immigrant unemployment rate is significantly below that of native-born Americans (5.1 %.)
(And remember: this government data understates the true displacement impact of immigration, because it doesn’t count the post-1965 wave’s U.S.-born children,
now a significant factor).
In other news: once again the foreign-born population seems to growing like gang-busters. The table shows a 1.478 million jump in working age immigrants since last August. That is larger than the commonly cited figure of 1 million for annual net legal immigration of all ages. That is also larger than the 1.280 million rise in the corresponding ![]() native-born population over that period.
native-born population over that period.
Over the past 12 months the working-age immigrant population grew 6.2 times faster than the corresponding population of native-born Americans.
Why the foreign-born surge? Could the prospect of a wall be more frightening than the specter of deportation?
Edwin S. Rubenstein (email him) is President of ESR Research Economic Consultants.


 “The new August jobs report is a prime example of data that affirms the status quo. And that’s not such a bad thing,” writes Neil Irwin in the New York Times, illustrating it with the chart on the right.[
 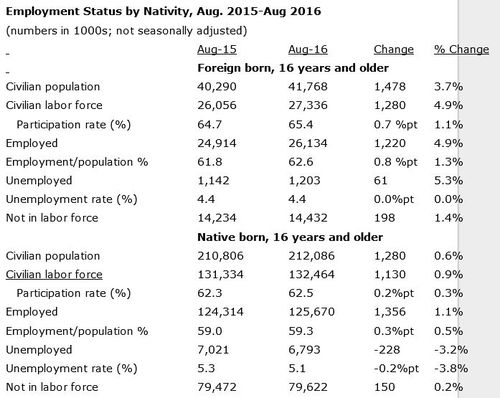 Source: BLS, The Employment Situation - August 2016, Table A-7, September 2, 2016.
  native-born population over that period.


