Crime stats are in the news, with California governor Gavin Newsom pointing out that of the 10 states with the highest murder rate, eight are Republican run:
Newsom said: the “question is simple. What are the laws and policies in those states that are leading to such carnage?”
Now, you know and I know, that murder/homicide rates by state are largely a function of the black percentage of the population.
But it’s interesting to compare states by their ratio of black homicide deaths to white homicide deaths. I used the CDC’s handy WONDER database query tool. This measures the race and ethnicity of homicides: deaths at the hands of another via assault. The results are slightly different from the FBI’s murder tallies (e.g., a 7-11 clerk outdrawing an armed robber is homicide but not murder), but the CDC doesn’t lump Hispanics with non-Hispanic whites like the FBI does.
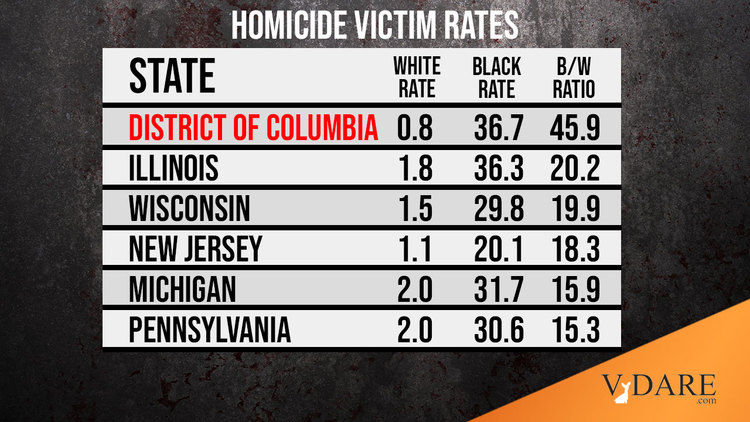
So here are homicide victim rates for non-Hispanic whites and blacks for the last ten years available, 2011-2010, sorted by the black to white ratio.
| Deaths by Homicide 2011-2020 |
CDC WONDER
|
|
|
| State |
White Rate |
Black Rate |
B/W Ratio |
| District of Columbia |
0.8 |
36.7 |
45.9 |
| Illinois |
1.8 |
36.3 |
20.2 |
| Wisconsin |
1.5 |
29.8 |
19.9 |
| New Jersey |
1.1 |
20.1 |
18.3 |
| Michigan |
2.0 |
31.7 |
15.9 |
| Pennsylvania |
2.0 |
30.6 |
15.3 |
| Nebraska |
1.8 |
23.9 |
13.3 |
| Missouri |
3.7 |
46.9 |
12.7 |
| Minnesota |
1.2 |
14.4 |
12.0 |
| Massachusetts |
1.0 |
11.4 |
11.4 |
| Indiana |
3.1 |
35.0 |
11.3 |
| Connecticut |
1.3 |
14.3 |
11.0 |
| Maryland |
2.1 |
22.7 |
10.8 |
| Ohio |
2.7 |
28.6 |
10.6 |
| Iowa |
1.8 |
18.4 |
10.2 |
| New York |
1.3 |
12.8 |
9.8 |
| Delaware |
2.1 |
20.6 |
9.8 |
| Kansas |
2.8 |
24.1 |
8.6 |
| California |
2.8 |
22.5 |
8.0 |
| Tennessee |
3.7 |
27.2 |
7.4 |
| Louisiana |
4.5 |
31.1 |
6.9 |
| Colorado |
2.6 |
17.8 |
6.8 |
| Virginia |
2.2 |
14.8 |
6.7 |
| Rhode Island |
1.4 |
9.3 |
6.6 |
| Kentucky |
4.0 |
24.8 |
6.2 |
| South Dakota |
1.8 |
11.0 |
6.1 |
| Arkansas |
4.8 |
28.3 |
5.9 |
| Alabama |
4.5 |
26.0 |
5.8 |
| Florida |
3.4 |
19.6 |
5.8 |
| North Carolina |
3.1 |
17.0 |
5.5 |
| Oregon |
2.5 |
13.6 |
5.4 |
| Washington |
2.4 |
13.0 |
5.4 |
| Oklahoma |
5.1 |
27.5 |
5.4 |
| Georgia |
3.1 |
16.6 |
5.4 |
| Arizona |
3.6 |
18.2 |
5.1 |
| Utah |
1.7 |
8.5 |
5.0 |
| Texas |
3.5 |
16.9 |
4.8 |
| South Carolina |
4.3 |
20.5 |
4.8 |
| Mississippi |
5.2 |
23.6 |
4.5 |
| Nevada |
4.6 |
20.8 |
4.5 |
| New Mexico |
4.8 |
21.1 |
4.4 |
| West Virginia |
4.8 |
20.9 |
4.4 |
| Alaska |
4.1 |
17.7 |
4.3 |
| Montana |
2.8 |
11.4 |
4.1 |
| North Dakota |
1.7 |
6.2 |
3.6 |
| Maine |
1.6 |
4.8 |
3.0 |
| Hawaii |
2.1 |
3.4 |
1.6 |
| Idaho |
1.9 |
NA |
NA |
| New Hampshire |
1.5 |
NA |
NA |
| Vermont |
1.8 |
NA |
NA |
| Wyoming |
3.0 |
NA |
NA |
The state with the most discriminatory rates of black to white homicide deaths is super-liberal Washington D.C.
Of course, D.C. isn’t a state. Among real states, I was guessing the biggest disparity would be in iSteve content generator old reliable Wisconsin, but the Cheesehead state was narrowly edged out by its neighbor (and also strong iSteve content generator) Illinois.
Illinois is a blue state, while Wisconsin is a purple state that happened to have a Democratic governor who egged on the Kenosha rioters during the crucial year of 2020.
Both Illinois and Wisconsin are on the Illinois Central railroad that brought so many welfare-seekers north from Mississippi, the state with the most homicidal whites, just barely edging out Oklahoma. Of course, all else being equal, the shootier the whites, the lower the B/W ratio in a state.
The top of the list for B/W Ratio tend to be states populated by the two northernmost of David Hackett Fischer’s British-American populations in Albion’s Seed: post-New Englanders and post-Pennsylvanians, both of whom tend to be well-behaved.
Fischer’s two more southern British-American populations, the lowland Southerners and the Borderers (Scots-Irish) are quicker on the draw.
The highest B/W Ratio state with more of a Scots-Irish or Greater Virginian population is #7 Missouri, whose blacks have shot each other in huge numbers since BLM emerged at Ferguson, MO in 2014. Missouri used to be a purple state, but it has recently moved very red due to the carnage unleashed in the St. Louis and Kansas City metro areas by liberal criminal justice “reformers.” Missouri has had, by far, the highest black homicide rate over the last ten years.
The greatest racial equality in homicide victimization rates tend to be in states where blacks mostly get there via the military. Hawaii is the most racially equal state in the country, with blacks only 1.6 times as likely to die by homicides as whites. Next are Maine and North Dakota, both of which have relative low homicide rates for blacks.
What about California vs. Florida? It’s hardly inconceivable that Newsom would be the Democrats’ 2024 Presidential nominee vs. Florida’s Ron DeSantis. Or in 2028.
California and Florida are pretty similar in non-Hispanic homicide rates. California has better-behaved non-Hispanic whites with a homicide death rate of 2.8 to Florida’s 3.4. But Florida’s blacks are less likely to die violently than are California’s, 19.6 to 22.5.
The lowest black homicide rates are in (in ascending order) Hawaii, Maine, North Dakota, Utah, Rhode Island, South Dakota, Montana, and Massachusetts.
The lowest white homicide rates are in D.C., Massachusetts, New Jersey, Minnesota, New York and Connecticut.
[Comment at Unz.com]