From Nate Silver’s FiveThirtyEight:
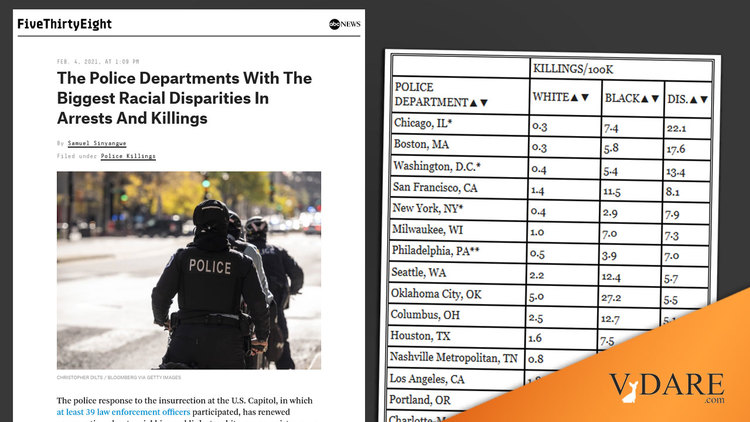
The Police Departments With The Biggest Racial Disparities In Arrests And Killings
By Samuel Sinyangwe, FEB. 4, 2021
The Biden administration plan to “root out” bias within the nation’s local police departments relies in large part on the U.S. Department of Justice’s authority to launch civil rights investigations and require the adoption of new use of force standards, accountability structures and other systemic changes in places where its investigators find a “pattern or practice” of unlawful or discriminatory policing. ...
Which cities should the Department of Justice investigate?
To determine which police departments might fit these criteria, I calculated per capita arrest rates and police killings rates for some of the largest U.S. cities’ police departments (cities with more than 500,000 residents, according to the U.S. Census). There are methodological differences to consider when interpreting this data. For example, Hispanic people are coded as Hispanic in the Mapping Police Violence database but coded racially as white or Black in the FBI’s Uniform Crime Report. This can underestimate the extent to which there are arrest disparities between non-Hispanic Black and white people since Hispanic people, who could have higher arrest rates than white people, are generally coded as white.
The best work-around to this apparently never-to-be-fixed problem with police data is to simply work with two categories: black vs. non-black.
Still, despite the limits of this data, some clear patterns can be identified. Black people were arrested and killed by police at higher rates than white people in 34 of the 37 largest U.S. cities. …
Arrests per 100 residents (2019) and police killings per 100,00 residents (2013-20) by race alongside disparities between those numbers for the police departments with the 37 largest jurisdictions in the U.S.
| |
ARRESTS/100 |
| POLICE DEPARTMENT▲▼ |
WHITE▲▼ |
BLACK▲▼ |
DIS.▲▼ |
| Washington, D.C.* |
0.9 |
6.4 |
7.3 |
| Seattle, WA |
1.1 |
7.0 |
6.1 |
| San Francisco, CA |
2.0 |
11.9 |
5.8 |
| Charlotte-Mecklenburg, NC |
1.0 |
4.8 |
4.8 |
| Portland, OR |
3.0 |
12.8 |
4.3 |
| Mesa, AZ |
3.1 |
12.9 |
4.2 |
| Chicago, IL* |
1.7 |
6.8 |
4.1 |
| Milwaukee, WI |
1.2 |
4.4 |
3.8 |
| Austin, TX |
2.5 |
9.4 |
3.8 |
| San Antonio, TX |
2.5 |
9.3 |
3.7 |
| Las Vegas Metro, NV |
3.9 |
13.2 |
3.4 |
| Houston, TX |
1.1 |
3.5 |
3.2 |
| San Diego, CA |
2.8 |
8.7 |
3.2 |
| Denver, CO |
3.6 |
11.0 |
3.1 |
| Oklahoma City, OK |
2.1 |
6.3 |
3.0 |
| Phoenix, AZ |
3.5 |
10.6 |
3.0 |
| Boston, MA |
0.8 |
2.4 |
2.9 |
| Baltimore, MD |
1.9 |
5.5 |
2.9 |
| Sacramento, CA |
3.0 |
8.3 |
2.8 |
| Tucson, AZ |
7.2 |
20.2 |
2.8 |
| New York, NY* |
2.0 |
5.5 |
2.7 |
| Memphis, TN |
2.3 |
6.3 |
2.7 |
| Columbus, OH |
1.0 |
2.5 |
2.6 |
| Albuquerque, NM |
4.0 |
10.4 |
2.6 |
| Jacksonville, FL* |
2.4 |
6.1 |
2.6 |
| Dallas, TX |
2.0 |
5.0 |
2.5 |
| Nashville Metropolitan, TN |
2.7 |
6.5 |
2.4 |
| Los Angeles, CA |
1.8 |
4.4 |
2.4 |
| San Jose, CA |
2.8 |
6.7 |
2.4 |
| Louisville Metro, KY |
4.3 |
10.0 |
2.3 |
| Fort Worth, TX |
1.8 |
4.1 |
2.3 |
| Indianapolis, IN |
2.8 |
6.1 |
2.2 |
| Honolulu, HI |
2.2 |
5.0 |
2.2 |
| Philadelphia, PA** |
2.3 |
4.6 |
2.0 |
| El Paso, TX |
2.6 |
5.2 |
2.0 |
| Fresno, CA** |
5.6 |
11.2 |
2.0 |
| Detroit, MI |
1.1 |
2.0 |
1.8 |
Amusingly, the top of the list of biggest disparities is dominated by famously liberal cities such as D.C., Seattle, and San Francisco, but who can notice such discordant patterns?
At the bottom of the list is Detroit, where few whites live anymore, and then the more conservative towns of Fresno and El Paso, which probably have to do with the white-Hispanic confusion.
And here are police killings by race from 2013-2020, which are even more dominated by liberal blue cities (typically with lots of well-behaved white yuppies):
| |
KILLINGS/100K |
| POLICE DEPARTMENT▲▼ |
WHITE▲▼ |
BLACK▲▼ |
DIS.▲▼ |
| Chicago, IL* |
0.3 |
7.4 |
22.1 |
| Boston, MA |
0.3 |
5.8 |
17.6 |
| Washington, D.C.* |
0.4 |
5.4 |
13.4 |
| San Francisco, CA |
1.4 |
11.5 |
8.1 |
| New York, NY* |
0.4 |
2.9 |
7.9 |
| Milwaukee, WI |
1.0 |
7.0 |
7.3 |
| Philadelphia, PA** |
0.5 |
3.9 |
7.0 |
| Seattle, WA |
2.2 |
12.4 |
5.7 |
| Oklahoma City, OK |
5.0 |
27.2 |
5.5 |
| Columbus, OH |
2.5 |
12.7 |
5.1 |
| Houston, TX |
1.6 |
7.5 |
4.7 |
| Nashville Metropolitan, TN |
0.8 |
3.8 |
4.7 |
| Los Angeles, CA |
1.8 |
8.2 |
4.6 |
| Portland, OR |
2.9 |
11.1 |
3.9 |
| Charlotte-Mecklenburg, NC |
1.0 |
3.7 |
3.7 |
| Louisville Metro, KY |
2.5 |
9.1 |
3.7 |
| Albuquerque, NM |
5.5 |
19.5 |
3.6 |
| San Antonio, TX |
3.0 |
10.5 |
3.5 |
| Indianapolis, IN |
2.1 |
7.5 |
3.5 |
| Baltimore, MD |
2.4 |
7.6 |
3.2 |
| Fort Worth, TX |
1.8 |
5.7 |
3.2 |
| Denver, CO |
3.0 |
8.0 |
2.7 |
| Sacramento, CA |
3.7 |
9.3 |
2.5 |
| Phoenix, AZ |
7.2 |
15.2 |
2.1 |
| Jacksonville, FL* |
4.2 |
8.6 |
2.1 |
| Tucson, AZ |
4.2 |
7.9 |
1.9 |
| Austin, TX |
4.0 |
7.2 |
1.8 |
| Las Vegas Metro, NV |
3.3 |
5.9 |
1.8 |
| San Diego, CA |
2.0 |
3.5 |
1.7 |
| Detroit, MI |
1.4 |
2.5 |
1.7 |
| Dallas, TX |
3.1 |
5.1 |
1.6 |
| El Paso, TX |
5.6 |
8.7 |
1.6 |
| Memphis, TN |
2.4 |
3.6 |
1.5 |
| San Jose, CA |
2.6 |
3.4 |
1.3 |
| Fresno, CA** |
3.5 |
2.7 |
0.8 |
| Mesa, AZ |
4.6 |
0.0 |
0.0 |
| Honolulu, HI |
2.2 |
0.0 |
0.0 |
The bottom of the list are mostly more conservative Sunbelt cities, many with a lot of Hispanics. Cities toward the bottom of the list tend to have more Wild West-type whites. In some, like Honolulu and San Diego, the blacks tend to have gotten there through military connections, which select for more law-abidingness and other good traits.
Because these patterns, while obvious on a moment’s reflection, are not in accordance with The Narrative, they are basically invisible to the media. As Orwell said, “To see what is in front of one’s nose needs a constant struggle.”