From the
New York Times:
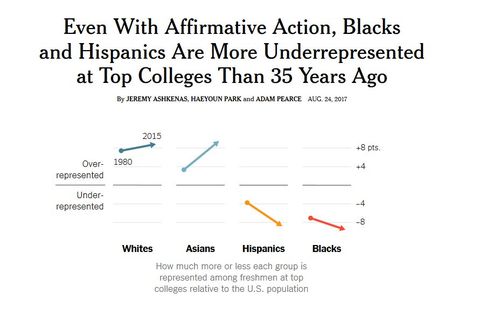
Even With Affirmative Action, Blacks and Hispanics Are More Underrepresented at Top Colleges Than 35 Years AgoBy JEREMY ASHKENAS, HAEYOUN PARK and ADAM PEARCE AUG. 24, 2017
Even after decades of affirmative action, black and Hispanic students are more underrepresented at the nation’s top colleges and universities than they were 35 years ago, according to a New York Times analysis.
- It’s almost as if 45 to 50 years of affirmative action haven’t succeeded in making blacks and Hispanics smarter …
Here’s the 1996-2011 trends in SAT Math scores from Unsilenced Science:
![]()
Not much is happening other than Asians are scoring higher.
Similarly, here’s Unsilenced Science’s graph of trends on the composite SAT and ACT college admission test scores:
![]()
Asians are pulling away from pack, while blacks are lagging. (The number of blacks taking these tests has been going up, so that performance isn’t all that bad.)
- And it’s almost as if the massive increase in Asian-American and foreign Asian enrollment in colleges had to hurt other groups’ numbers due to simple arithmetic.
The share of black freshmen at elite schools is virtually unchanged since 1980.
When, by the way, affirmative action was roaring strong. You may recall the famous
Bakke lawsuit over racial quotas at the University of California reached the U.S. Supreme Court in 1978, when Judge Powell’s one-man decision somehow wound up being decisive. Powell’s baby slicing brilliance: racial quotas are illegal if you call then “quotas” but not if you call them “goals.”
Part of what the NYT is doing is playing off their readers’ lack of historical sense. Subscribers are constantly told that America was a racist hell-hole until approximately the day before yesterday, so “1980? sounds like the Dark Ages to them. In reality of course, it was well past the social revolution of the 1960s, with affirmative action going full blast.
Black students are just 6 percent of freshmen but 15 percent of college-age Americans, as the chart below shows.![Screenshot 2017-08-24 17.47.08]()
The NYT won’t tell us what the actual numbers were in 1980 (which turns out to be a bigger problem below with the Hispanic graph), but it looks like 1980 numbers were something like blacks being 13% of the college-age population and 6% of elite college freshmen.
It would be interesting to see what % blacks made up in the 90th percentile or higher on the SAT and ACT test in 1980 versus 2015. My guess would be it was a small percentage in 1980 and an even smaller percentage in 2015 due to the flood of high scoring Asians.
Here’s a recent Brookings Institution graph:
![Screenshot 2017-08-24 17.56.56]()
Blacks make up only 2% of those scoring on the math SAT 650 to 700, 2% of 700 to 750, and 2% of 750 to 800. In contrast Asians make up 27% of 650 to 700, 39% of 700 to 750, and 60% of 750 to 800.
A 650 on math is a good score, but not amazing: it’s at the 86th percentile of those who take the SAT and the 90th percentile of a nationally representative sample (including those who missed out on taking the SAT because they were in Juvy Hall). So blacks make up 6% of elite college freshmen but only 2% among those scoring at the 86th percentile or higher on the Math SAT. Of course, blacks don’t benefit from White Privilege.
Here’s the Brookings article on how test score gaps aren’t closing much.
I don’t know what this graph would have looked like in 1980, but the immense Asian numbers at the high end wouldn’t have been so big, thus increasing the other groups’ representation proportionately.
More Hispanics are attending elite schools, but the increase has not kept up with the huge growth of young Hispanics in the United States, so the gap between students and the college-age population has widened.![Screenshot 2017-08-24 17.52.38]()
Now here’s where the NYT’s methodology becomes intentionally misleading. They won’t tell us what the actual numbers were in 1980, but it looks like back then Hispanics were about 7% of the population and 4% of the elite freshmen, compared to 22% and 13% in 2015. Those proportions are roughly the same, so not much has really happened. For example 4/7 = 0.57 and 13/22 = 0.59, suggesting a slight increase in favor of Hispanics over the years. But of course these are guesstimates from eyeballing the graph.
But the NYT can claim that The Gap has gotten … three … times … larger!
The Times analysis includes 100 schools ranging from public flagship universities to the Ivy League. For both blacks and Hispanics, the trend extends back to at least 1980, the earliest year that fall enrollment data was available from the National Center for Education Statistics.Blacks and Hispanics have gained ground at less selective colleges and universities but not at the highly selective institutions, said Terry Hartle, a senior vice president at the American Council on Education, which represents more than 1,700 colleges and universities.
The 1985 book
Choosing Elites by social scientist Robert Klitgaard, who went on to be president of Claremont McKenna college, reveals much about Harvard’s 1970s internal studies of just how much affirmative action Harvard could afford. This turned out to be some, but not as much as they had hoped when they got started with quotas in the late 1960s. In particular, inner city black males were not a good bet.
Here’s the NYT’s graph of the racial trends at the alpha dog of academia, Harvard:
![Screenshot 2017-08-24 19.15.47]()
Although this is just speculation, it sure looks like Harvard decided during the 1990s that allowing the white percentage to continue to fall sharply, as it had in the 1980s, would eventually prove Bad for the Brand.
- One other thing that’s going on is that white parents and students have tended to become much more ambitious and/or fatalistic about attending elite national private colleges since I was in high school. For example, it was standard for my friends from our Catholic school to attend cheap U. of California campuses, but the NYT graphs show whites barely showing up at many UC colleges anymore. For example, here is UC Irvine in Orange County where whites make up only 15% of the freshmen:
![Screenshot 2017-08-24 18.16.27]()
Today it seems as if a huge fraction of white parents are just convinced that of course they will have to spend an extra $125k to send their kids to a private college in another state instead of to a public college that they’ve been supporting with their tax dollars their whole lives. That’s what you have to do if you are white.
By the way, if you are wondering why the expensive Claremont colleges in Southern California are having so many hissy fits, as frequently reported here and more recently reported in the NYT (“More Diversity Means More Demands,” here’s a graph of Claremont’s STEM college Harvey Mudd’s trajectory:
![Screenshot 2017-08-24 20.38.02]()
Harvey Mudd recently got woke and decided to let in lots of Non-Asian Minorities and girls, because obviously things like test scores must be biased, with the results that you or I would expect:
An elite California college canceled 2 days of classes amid tension over workload and racial issues on campusInside Higher Ed