The new Census release informs us that a record 41.3 million foreign-born persons reside in the United States as of 2013, comprising 13.1 percent of the population, the highest proportion in 93 years.
In another sign of growing diversity, the WSJ on Sept. 24 reported Limited English Limits Job Prospects: Study Finds 1 in 10 Working-Age Adults Has Limited Proficiency. The article notes, “In Los Angeles and Miami, about a quarter of the working-age population has limited English” so the perhaps the language layabouts have congregated in those cities where Spanish is spoken widely. Or maybe the newbies depend on lots of bilingual food stamps and other freebies to get by.
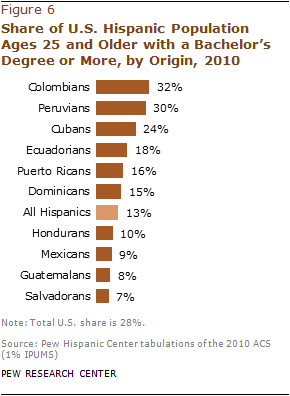
![]() The Center for Immigration Studies has a paper on the Census report, U.S. Immigrant Population Record 41.3 Million in 2013, that includes a helpful list of important points revealed in the new numbers. I’ve pulled out a few that are interesting because they show how immigration has been turned against the American interest: Many thousands from unfriendly Muslim nations (like Saudi Arabia — 40,000 immigrants in three years) and many more from third world backwaters (like Guatemala — 71,000 immigrants in three years) known for disinterest in scholarship (see chart) and headed for the permanent underclass. Elites seem determined to make the United States as un-American as possible.
The Center for Immigration Studies has a paper on the Census report, U.S. Immigrant Population Record 41.3 Million in 2013, that includes a helpful list of important points revealed in the new numbers. I’ve pulled out a few that are interesting because they show how immigration has been turned against the American interest: Many thousands from unfriendly Muslim nations (like Saudi Arabia — 40,000 immigrants in three years) and many more from third world backwaters (like Guatemala — 71,000 immigrants in three years) known for disinterest in scholarship (see chart) and headed for the permanent underclass. Elites seem determined to make the United States as un-American as possible.
• The nation’s immigrant population (legal and illegal) hit a record 41.3 million in July 2013, an increase of 1.4 million since July 2010. Since 2000 the immigrant population is up 10.2 million.• The 41.3 million immigrant population (legal and illegal) in 2013 was double the number in 1990, nearly triple the number in 1980, and quadruple that in 1970, when it stood at 9.6 million.
• The sending regions with the largest increases from 2010 to 2013 were South Asia (up 373,000, 16 percent growth); East Asia (up 365,000, 5 percent growth); the Caribbean (up 223,000, 6 percent growth), the Middle East (up 208,000, 13 percent growth); and sub-Saharan Africa (up 177,000, 13 percent growth).
• The sending countries with the largest increases 2010 to 2013 were India (up 254,000, 14 percent growth); China (up 217,000, 10 percent growth); the Dominican Republic (up 112,000, 13 percent growth); Guatemala (up 71,000, 9 percent growth); Jamaica (up 55,000, 8 percent growth); Bangladesh (up 49,000, 32 percent growth); Saudi Arabia (up 44,000, 97 percent growth); Pakistan (up 43,000, 14 percent growth); and Iraq (up 41,000, 26 percent growth).
• Between 2010 and 2013, four million new immigrants settled in the United States; and since 2007, when the Great Recession began, at least 7.5 million immigrants have settled in the country.
• As a share of the population, immigrants (legal and illegal) comprised 13.1 percent of U.S. residents (about one out of every eight), the highest percentage in 93 years. As recently as 1980, 6.2 percent of the country was comprised of immigrants.
• Immigrants comprised 16 percent of the adult population (18-plus) in 2013, nearly one out of every six adults.
• Mexicans accounted for the largest immigrant population in the United States by far, with 11.6 million legal and illegal immigrants living in the United States in 2013. However, the number of Mexican immigrants in the country declined 1 percent from 2010 to 2013.
• The number of immigrants from Europe also declined.


 The Center for Immigration Studies has a paper on the Census report,


