


Here’s a big academic study that is getting cited for implying, in so many words, that one reason blacks do worse on school tests is because evil white racist schoolteachers impose too much discipline on them. As you’ll recall, that was the policy of the late Obama Administration, but the Trump Administration eased off on the federal witch hunt for racist disciplinarians:
Are Achievement Gaps Related to Discipline Gaps? Evidence From National Data
Francis A. Pearman, II, F. Chris Curran, Benjamin Fisher, First Published October 15, 2019 Research Article
There is growing interest in the relation between the racial achievement gap and the racial discipline gap. However, few studies have examined this relation at the national level. This study combines data from the Stanford Education Data Archive and the Civil Rights Data Collection and employs a district fixed effects analysis to examine whether and the extent to which racial discipline gaps are related to racial achievement gaps in Grades 3 through 8 in districts across the United States. In bivariate models, we find evidence that districts with larger racial discipline gaps have larger racial achievement gaps (and vice versa). Though other district-level differences account for the positive association between the Hispanic-White discipline gap and the Hispanic-White achievement gap, we find robust evidence that the positive association between the Black-White discipline gap and the Black-White achievement gap persists after controlling for a multitude of confounding factors. We also find evidence that the mechanisms connecting achievement to disciplinary outcomes are more salient for Black than White students.
I think this paper is a good example of why my techniques for critiquing social science studies are so much more effective and interesting than mainstream gullibility.
One of my basic techniques is to provide readers with lots and lots of examples so you can notice the patterns too. For example, back in 2016 when I first got a look at the Stanford Education Data Archive of test scores for just about every school district in the country, I immediately sorted them in order of white-black test score gap.
Without any examples, you could just imagine where blacks are most oppressed by whites: probably in some super-Republican small town in the South, right?
Wrong. The top 5 worst race gaps were found in Berkeley, Chapel Hill, Shaker Heights, Asheville, and Evanston: i.e., all famously liberal places.
On the other hand, the highest black and Hispanic test scores in the country were found in highly Republican Frisco, TX, a sports-crazed exurb of Dallas.
In contrast, this new study links the old Stanford Education Data Archive to a list of suspensions by race. But the authors give zero examples of school districts where blacks are suspended far more than whites or districts where whites score the most more than blacks. You are just supposed to imagine based on your prejudices which places they must be.
Unfortunately, I haven’t found a way to get access to their data, so I don’t know what their data would show in the way of examples.

Here’s the funniest bit in the new study:
(It should be noted that the share of Asian students and American Indian/Pacific Islander students is too small to produce reliable national estimates for racial achievement disparities between them and White students.)
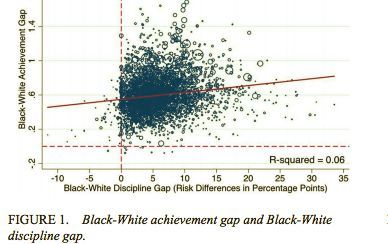
Yeah, right … You’ve got practically every school district in the country — looking how many datapoints there are in the above scatter plots for white-black and white-Hispanic gaps — but that’s just not enough to produce reliable national estimates for racial achievement disparities between Asian students and white students.
Nah, you just want to cover up the Asian numbers because they undermine The Narrative. In reality, as I calculated from the huge SEDA database in 2019, the average Asian public school sixth grader is 0.8 grade levels ahead of the average white, while Asians lead Hispanics by 2.6 grade levels and blacks by 3.0 grade levels.
A detail likely to be overlooked is that the researchers admit that the Suspension Gap is small potatoes in terms of the Achievement Gap:
Finally, even when discipline gaps are zero (i.e., suspension rates for ethnoracial minorities are equal to
those for White students), Black-White and Hispanic-White achievement gaps are roughly 0.55 and 0.42 standard deviations, respectively. Note that in the average school district, the achievement gap between Black and White students is 0.58 standard deviations and the average achievement gap between Hispanic and White students is 0.48 standard deviations.
One interesting finding is that the researchers can adjust away the white-Hispanic suspension rate gap by factoring in parents’ education and other measures of class and the like. In other words, whites and Hispanics of similar backgrounds tend to be pretty similar in behavior in the classroom, it’s just that a lot higher percentage of Hispanics are proles rather than bourgeoisie.
On the other hand, no amount of statistic adjustment for background could make the black tendency to get in trouble more disappear.


