A friend asked how many incremental deaths have there been due to the Floyd Effect? 3,000?
Nah, it’s more like 36,000, according to a simplistic methodology that takes CDC death counts for homicides and motor vehicle accidents for the years 2020-2022 and compares them them to how many there would have been if the average of 2018-19 had been maintained for the first three years of the 2020s. I come up with 2020 to 2022 having seen 36,042 additional Deaths of Exuberance (killings and car crashes) than if the death toll had stayed at the same annual rate as in 2018-2019.
That’s a pretty big number.
These 36,000 incremental deaths are divided pretty equally into extra homicides and extra traffic fatalities. And they are about equally split into incremental black deaths and incremental all other deaths. (Note that the Totals below include deaths of Pacific Islanders, American Indians, and persons of mixed race in addition to the major categories listed.)
| The Floyd Effect | ||||||
| Homicide Deaths | ||||||
| Year | Period | Total | Black | White | Hispanic | Asian |
| 2018 | Pre | 18,830 | 9,469 | 5,460 | 3,045 | 263 |
| 2019 | Pre | 19,141 | 9,951 | 5,176 | 3,122 | 292 |
| 2020 | Post | 24,576 | 13,493 | 6,143 | 3,920 | 289 |
| 2021 | Post | 26,031 | 14,313 | 6,215 | 4,453 | 313 |
| 2022 | Post | 24,830 | 13,225 | 5,975 | 4,480 | 310 |
| Total 2018-19 | 37,971 | 19,420 | 10,636 | 6,167 | 555 | |
| Total 2020-22 | 75,437 | 41,031 | 18,333 | 12,853 | 912 | |
| Avg 2018-19 | 18,986 | 9,710 | 5,318 | 3,084 | 278 | |
| Avg 2020-22 | 25,146 | 13,677 | 6,111 | 4,284 | 304 | |
| Incr in Avg Deaths / Year | 6,160 | 3,967 | 793 | 1,201 | 27 | |
| % Incr in Avg | 32% | 41% | 15% | 39% | 10% | |
| Incremental Deaths 2020-22 vs. 2018-19 Avg | 18,481 | 11,901 | 2,379 | 3,603 | 80 | |
| Share of Incremental | 64% | 13% | 19% | 0% | ||
|
Motor Vehicle Accident Deaths |
||||||
| Year | Period | Total | Black | White | Hispanic | Asian |
| 2018 | Pre | 39,404 | 6,140 | 25,095 | 6,123 | 837 |
| 2019 | Pre | 39,107 | 6,196 | 24,770 | 6,165 | 824 |
| 2020 | Post | 42,339 | 7,882 | 25,402 | 7,059 | 790 |
| 2021 | Post | 46,980 | 8,583 | 27,805 | 8,143 | 932 |
| 2022 | Post | 46,009 | 7,815 | 27,234 | 8,422 | 979 |
| Total 2018-19 | 78,511 | 12,336 | 49,865 | 12,288 | 1,661 | |
| Total 2020-22 | 135,328 | 24,280 | 80,441 | 23,624 | 2,701 | |
| Avg 2018-19 | 39,256 | 6,168 | 24,933 | 6,144 | 831 | |
| Avg 2020-22 | 45,109 | 8,093 | 26,814 | 7,875 | 900 | |
| Incr in Avg Deaths / Year | 5,854 | 1,925 | 1,881 | 1,731 | 70 | |
| % Incr in Avg | 15% | 31% | 8% | 28% | 8% | |
| Incremental Deaths 2020-22 vs. 2018-19 Avg | 17,562 | 5,776 | 5,644 | 5,192 | 210 | |
| Share of Incremental | 33% | 32% | 30% | 1% | ||
| Homicide + Road Deaths | ||||||
| Year | Period | Total | Black | White | Hispanic | Asian |
| 2018 | Pre | 58,234 | 15,609 | 30,555 | 9,168 | 1,100 |
| 2019 | Pre | 58,248 | 16,147 | 29,946 | 9,287 | 1,116 |
| 2020 | Post | 66,915 | 21,375 | 31,545 | 10,979 | 1,079 |
| 2021 | Post | 73,011 | 22,896 | 34,020 | 12,596 | 1,245 |
| 2022 | Post | 70,839 | 21,040 | 33,209 | 12,902 | 1,289 |
| Total 2018-19 | 116,482 | 31,756 | 60,501 | 18,455 | 2,216 | |
| Total 2020-22 | 210,765 | 65,311 | 98,774 | 36,477 | 3,613 | |
| Avg 2018-19 | 58,241 | 15,878 | 30,251 | 9,228 | 1,108 | |
| Avg 2020-22 | 70,255 | 21,770 | 32,925 | 12,159 | 1,204 | |
| Incr in Avg Deaths / Year | 12,014 | 5,892 | 2,674 | 2,932 | 96 | |
| % Incr in Avg | 21% | 37% | 9% | 32% | 9% | |
| Incremental Deaths 2020-22 vs. 2018-19 Avg | 36,042 | 17,677 | 8,023 | 8,795 | 289 | |
| Share of Incremental | 49% | 22% | 24% | 1% |
Second, I didn’t bother adjusting for the modest population change during these years.
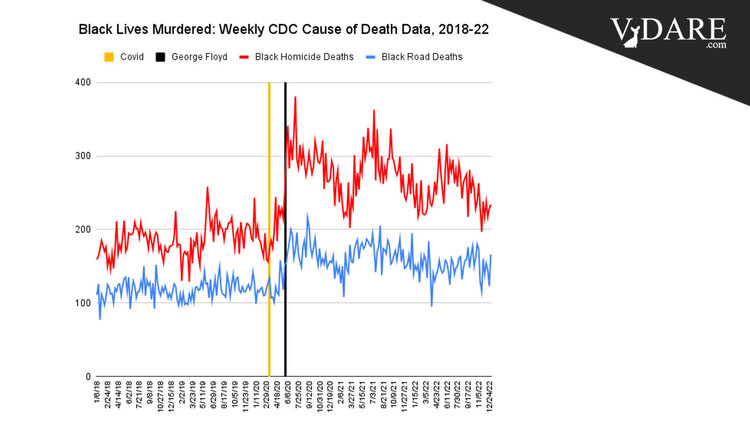
Third, the Floyd Effect didn’t begin on January 1, 2020, like I assume, but on May 25, 2020. Motor vehicle accident deaths weren’t up much in 2020 compared to previous years before Floyd Day. But black homicide deaths, after falling quite a bit in 2018 with the end of the Ferguson Effect under the Sessions Justice Department, began to creep upward again partway through 2019 and were rising in early 2020 before COVID and also during early COVID, before exploding in the last week of May during the first of the Mostly Peaceful Protests.
 But graphing weekly data of black deaths, there’s no doubt that the Floyd Effect is closely linked to the demise of George Floyd and the subsequent cultural revolution. As you may recall, the “racial reckoning” was in all the papers at the time.
So, the fairest estimate of incremental deaths due to the Floyd Effect in 2020-2022 might be “approaching 35,000.” The Floyd Effect is no doubt continuing to pile up more incremental deaths in 2023, although homicides appear to be dropping (but are still well above the 2018-2019 rate).
Approaching 35,000 is quite a few deaths, especially among fairly young people with a lot of life expectancy left. It’s very similar to American deaths in the Korean War of 36,516, and more than five times the total deaths in the Iraq and Afghanistan Wars combined.
[Note: In CDC data, “homicides” refer to homicide victimizations, not homicide perpetrations.]