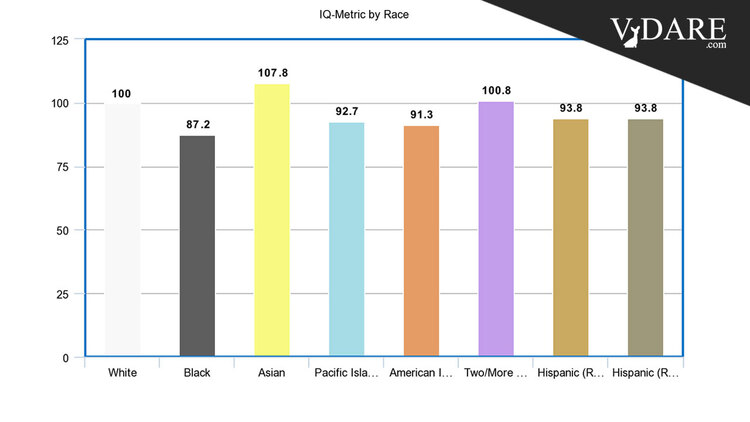
At the data-intense Human Varieties blog, Chuck sums up average SAT or ACT score submitted to the Common App in 2021. Like the name says, the Common App is the most common way to apply to college online (with 900+ colleges accepting applications submitted vias the Common App), so the sample sizes are large: Chuck says over 1 million applicants per year.
Like the Adolescent Brain Cognitive Development (ABCD) database of 10-year-olds (for which I graphed Chuck’s findings of average IQ by ethnicity at Taki’s), the Common App pries deeply into applicants, so Chuck can come up with average SAT/ACT scores (on the SAT’s more famous 400 to 1600 scale) for all sorts of detailed ethnicities:
| Ethnic |
N |
Submits |
SAT/ACT Avg |
GPA |
IQ-metric (White=100) |
| White |
|
|
|
|
|
| Average |
570,400 |
53% |
1278 |
92 |
100.0 |
| Two+ Provided |
17,640 |
52% |
1310 |
93 |
102.4 |
| Europe |
464,670 |
55% |
1287 |
93 |
100.7 |
| Middle East |
22,720 |
39% |
1236 |
90 |
96.9 |
| None Provided |
39,580 |
43% |
1206 |
91 |
94.6 |
| Other |
25,800 |
35% |
1159 |
88 |
91.1 |
| |
|
|
|
|
|
| African American |
|
|
|
|
|
| Average |
140,010 |
36% |
1108 |
85 |
87.2 |
| Africa |
13,840 |
34% |
1185 |
87 |
93.0 |
| Two+ Provided |
17,740 |
39% |
1170 |
87 |
91.9 |
| None Provided |
670 |
29% |
1141 |
85 |
89.7 |
| Caribbean |
10,610 |
37% |
1116 |
85 |
87.8 |
| Other |
680 |
27% |
1113 |
84 |
87.6 |
| U.S. Af-Am |
96,470 |
35% |
1084 |
84 |
85.4 |
| |
|
|
|
|
|
| Asian |
|
|
|
|
|
| Average |
115,490 |
61% |
1382 |
95 |
107.8 |
| None Provided |
1,600 |
65% |
1438 |
97 |
112.0 |
| Korea |
10,480 |
67% |
1421 |
96 |
110.7 |
| India |
32,750 |
72% |
1415 |
96 |
110.3 |
| China |
24,620 |
64% |
1414 |
97 |
110.2 |
| Other East Asia |
2,800 |
59% |
1411 |
95 |
110.0 |
| Malaysia |
240 |
61% |
1380 |
95 |
107.6 |
| Two+ Provided |
8,520 |
58% |
1376 |
96 |
107.3 |
| Japan |
1,330 |
57% |
1364 |
94 |
106.4 |
| Other South Asia |
5,620 |
45% |
1309 |
92 |
102.3 |
| Pakistan |
5,500 |
50% |
1301 |
92 |
101.7 |
| Vietnam |
9,090 |
55% |
1284 |
94 |
100.5 |
| Philippines |
8,100 |
47% |
1262 |
94 |
98.8 |
| Other Southeast Asia |
4,130 |
44% |
1261 |
92 |
98.7 |
| Cambodia |
700 |
36% |
1216 |
92 |
95.4 |
| |
|
|
|
|
|
| Pacific Islander |
|
|
|
|
|
| Group Average |
1,770 |
32% |
1181 |
88 |
92.7 |
| None Provided |
100 |
36% |
1246 |
91 |
97.6 |
| Guam |
220 |
34% |
1233 |
91 |
96.6 |
| Other (Excl. Philippines) |
570 |
30% |
1204 |
86 |
94.5 |
| Two+ Provided |
150 |
28% |
1187 |
87 |
93.2 |
| Hawaii |
420 |
35% |
1180 |
88 |
92.6 |
| Samoa |
320 |
33% |
1082 |
88 |
85.3 |
| |
|
|
|
|
|
| American Indian |
|
|
|
|
|
| Average |
2,760 |
36% |
1162 |
87 |
91.3 |
| OK Citizen Potawatomi |
20 |
29% |
1338 |
90 |
104.5 |
| OK Choctaw |
90 |
55% |
1267 |
93 |
99.2 |
| OK Chickasaw |
50 |
52% |
1252 |
90 |
98.1 |
| OK Muscogee (Creek) Nation |
50 |
59% |
1241 |
91 |
97.2 |
| OK Cherokee |
140 |
53% |
1218 |
95 |
95.5 |
| MI Sault Ste. Marie |
40 |
57% |
1192 |
88 |
93.5 |
| NY Saint Regis |
50 |
16% |
1170 |
86 |
91.9 |
| None Provided |
80 |
29% |
1153 |
87 |
90.7 |
| Unenrolled |
1,370 |
34% |
1147 |
86 |
90.2 |
| Other Enrolled |
640 |
34% |
1146 |
87 |
90.1 |
| SD Oglala Sioux |
20 |
18% |
1123 |
90 |
88.3 |
| AZ Navajo |
160 |
29% |
1096 |
89 |
86.3 |
| NC Eastern Cherokee |
40 |
41% |
1079 |
87 |
85.1 |
| |
|
|
|
|
|
| Two/More Races |
|
|
|
|
|
| Group Average |
56,130 |
50% |
1289 |
92 |
100.8 |
| Asian & White |
25,400 |
60% |
1354 |
95 |
105.7 |
| Asian & Pacific Islander |
1,020 |
43% |
1278 |
93 |
100.0 |
| Asian & American Indian |
140 |
45% |
1266 |
88 |
99.1 |
| White & Pacific Islander |
1,010 |
48% |
1265 |
92 |
99.0 |
| White & Native American |
4,620 |
50% |
1248 |
91 |
97.7 |
| Three or More Races |
3,610 |
41% |
1241 |
90 |
97.2 |
| Asian & African Am. |
2,680 |
43% |
1224 |
90 |
96.0 |
| White & African Am. |
15,680 |
40% |
1192 |
88 |
93.5 |
| African Am. & Pacific Isl. |
40 |
19% |
1118 |
83 |
88.0 |
| Native Am. & Pacific Isl. |
1,540 |
31% |
1095 |
84 |
86.2 |
| African Am. & Native Am. |
380 |
34% |
1093 |
84 |
86.1 |
| |
|
|
|
|
|
| Hispanic (Region) |
|
|
|
|
|
| Group Average |
194,060 |
37% |
1195 |
89 |
93.8 |
| Spain |
4,950 |
48% |
1284 |
92 |
100.4 |
| South America |
24,800 |
46% |
1247 |
91 |
97.7 |
| Cuba |
6,860 |
61% |
1236 |
92 |
96.9 |
| Two+ Provided |
28,730 |
41% |
1211 |
90 |
94.9 |
| Mexico |
70,270 |
32% |
1170 |
89 |
91.9 |
| Central America |
17,400 |
32% |
1168 |
89 |
91.8 |
| Puerto Rico |
22,540 |
37% |
1168 |
87 |
91.7 |
| None Provided |
1,850 |
29% |
1161 |
87 |
91.2 |
| Other |
16,670 |
30% |
1152 |
87 |
90.5 |
| |
|
|
|
|
|
| Hispanic (Races) |
|
|
|
|
|
| Group Average |
194,060 |
37% |
1195 |
89 |
93.8 |
| Asian |
3,290 |
43% |
1277 |
92 |
99.9 |
| Two+ Provided |
9,750 |
43% |
1235 |
90 |
96.7 |
| White |
96,690 |
45% |
1219 |
90 |
95.6 |
| Hispanic or Latinx Only |
60,870 |
27% |
1146 |
88 |
90.1 |
| American Indian |
4,740 |
29% |
1133 |
87 |
89.1 |
| African American |
17,740 |
29% |
1116 |
85 |
87.8 |
| Pacific Islander |
980 |
25% |
1097 |
85 |
86.4 |
The rank order of average scores is quite similar to the ABCD’s IQ test averages for 10-year-olds.
But the absolute averages are highly inflated (e.g., the white average is 1278 on the SAT’s 400 to 1600 scale). The idea behind the SAT is for the mean to be 1000 with a standard deviation of 200. This inflation is due to a number of reasons, most notably this data is from 2021 and most colleges made submitting test scores optional for pandemic/racial reckoning reasons.
The Submits column shows that only 53% of applications were accompanied by test scores among whites (1278 average), 36% among blacks (1108), 61% among Asians (1382), and 37% among Hispanics (1195). Presumably, applicants who chose not to submit their test scores did worse on average than those who chose to submit their test scores. So the racial gaps would likely be even larger if we knew everybody’s tests scores.
By the way, the IQ-Metric column does not represent actual IQ scores: an SAT of 1278 would be considerably higher than 100. They are just doing the standard routine of setting the white average to 100 with a standard deviation of 15.
At Human Varieties back in August, Meng Hu posted a third set of test score numbers—the feds’ National Postsecondary Student Aid Study (NPSAS). In 2016 and 2020, the researchers asked over 100,000 undergrads some questions about their finances and also obtained their SAT/ACT scores. This is different from Common App data above in that it’s only scores from people who are attending college. Meng Hu converted the SAT/ACT data to the usual IQ-Metric scale with the white average at 100 and got … pretty much the same rank order of results as the Common App SAT/ACT scores and the same as the ABCD got on the NIH Cognitive Test Toolbox given to 10,000 ten-year-olds.
| |
NPSAS SAT |
ABCD IQ |
|
| |
IQ-metric |
N-est. |
NIH-IQ |
N |
SAT-ABCD IQ Diff
|
| White & Asian Indian |
109.4 |
323 |
109.6 |
44 |
-0.2 |
| Chinese |
108.6 |
2,469 |
111.3 |
81 |
-2.8 |
| White & Chinese |
108.2 |
804 |
105.2 |
77 |
3.0 |
| Korean & Japanese |
107.5 |
1,198 |
110.1 |
33 |
-2.5 |
| Asian Indian |
107.1 |
1,742 |
102.4 |
53 |
4.7 |
| Mixed Asian |
104.9 |
1,208 |
|
|
|
| White & Korean/Japanese |
104.3 |
1,435 |
106.7 |
78 |
-2.4 |
| White & Vietnamese |
102.0 |
295 |
|
|
|
| Vietnamese |
101.6 |
1,473 |
98.7 |
24 |
2.9 |
| White & Filipino |
101.0 |
921 |
105.1 |
60 |
-4.1 |
| White |
100.0 |
131,370 |
100.0 |
5,858 |
0.0 |
| Filipino |
98.9 |
1,447 |
103.5 |
51 |
-4.7 |
| White & Pacific Islander |
98.5 |
1,491 |
99.7 |
25 |
-1.2 |
| Other Asian |
98.4 |
2,137 |
102.5 |
52 |
-4.1 |
| White & Native American |
96.7 |
3,360 |
95.6 |
144 |
1.1 |
| White Cuban |
95.8 |
993 |
91.7 |
151 |
4.1 |
| NH Black & White |
94.7 |
6,033 |
91.6 |
418 |
3.1 |
| White Puerto Rican |
94.4 |
3,415 |
91.0 |
133 |
3.4 |
| Other Hispanic |
93.1 |
10,567 |
91.3 |
518 |
1.9 |
| Pacific Islander |
93.0 |
912 |
96.1 |
17 |
-3.1 |
| Mixed Hispanic |
92.3 |
4,750 |
|
|
|
| White Mexican |
91.9 |
19,596 |
91.8 |
775 |
0.1 |
| Native American |
91.5 |
1,802 |
89.2 |
39 |
2.3 |
| Other Cuban |
90.9 |
170 |
89.7 |
30 |
1.2 |
| Black & Other Puerto R. |
90.9 |
1,273 |
87.7 |
90 |
3.2 |
| NH Black immigrant |
90.5 |
5,824 |
89.7 |
110 |
0.7 |
| Other Mexican |
90.4 |
3,763 |
88.8 |
460 |
1.6 |
| USA Black |
89.2 |
23,974 |
83.0 |
1,499 |
6.2 |
There are some interesting differences. American blacks come in last in both very different kinds of studies, but the white-black gap is much smaller in terms of college admission test scores among undergrads: the equivalent of 10.8 IQ points vs. 17.0 IQ points among ten-year-olds on the ABCD. One reason is presumably that very low scoring blacks tend not to go to college or stay there long if they do. Another could be that the white sample in the ABCD, which tries to be nationally representative, is skewed a little upscale for whites.
The big problem facing the next generation of African-American youth hoping to earn elite jobs is not White Supremacy or Systemic Racism or whatever people like to talk about, it’s something few mention: that their chances are being overwhelmed by Asian immigrants.
[Comment at Unz.com]