Everybody knows that SAT scores have increasingly diverged by household income. For example, a long
New York Times Magazine piece about David Coleman and his proposed changes in the SAT takes that as a given:
Students despised the SAT not just because of the intense anxiety it caused — it was one of the biggest barriers to entry to the colleges they dreamed of attending — but also because they didn’t know what to expect from the exam and felt that it played clever tricks, asking the kinds of questions they rarely encountered in their high-school courses. Students were docked one-quarter point for every multiple-choice question they got wrong, requiring a time-consuming risk analysis to determine which questions to answer and which to leave blank. Teachers, too, felt the test wasn’t based on what they were doing in class, and yet the mean SAT scores of many high schools were published by state education departments, which meant that blame for poor performances was often directed at them.
An even more serious charge leveled at the test was that it put students whose families had money at a distinct advantage, because their parents could afford expensive test-prep classes and tutors.
This may very well be, but
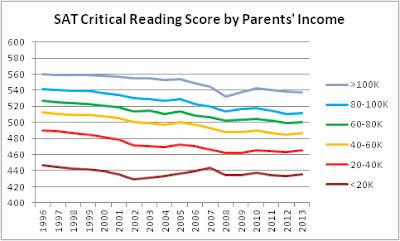
Unsilenced Science has created the graphs above that show not a widening gap in test scores between income brackets, but a
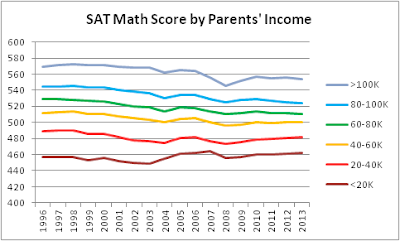
narrowing gap. For example, in 1996, the gap on Critical Reading (Verbal) between the average score of students with incomes under $20K and students with incomes over $100K was 113 points, versus only 102 points in 2013. The narrowing of the gap among high and low income students on the Math subtest has been even greater.
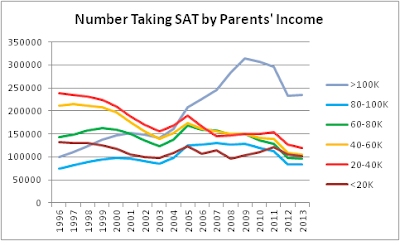
Now, some of that narrowing is caused by inflation: people making over $100k aren't as elite on average in 2013 as in 1996. You can see an especially sharp decline in average SAT scores among the six-figure crowd during the Bush Bubble when lots of test-takers' parents were temporarily propelled into the >$100k range by selling each other subprime mortgages and fancy rims for their Hummers:
I wouldn't take the huge growth in the number of six-figure students taking the SAT wholly at face value. I suspect that some of the growth comes from Midwesterners who, in the past, would have taken only the ACT also starting to take the SAT as well. (Certainly the growth in numbers of ACT takers has grown from Easterners starting to take the ACT as well to increase their chances of a high score.)
But the test scores of the bottom income ranges have been going up over the last half decade, so there is possibly some genuine narrowing of the gap, and quite likely no widening.
There are lots more informative graphs
where these came from.
By the way, does anybody know how accurate these income estimates are? Are they getting them from parents or from students?