![]()
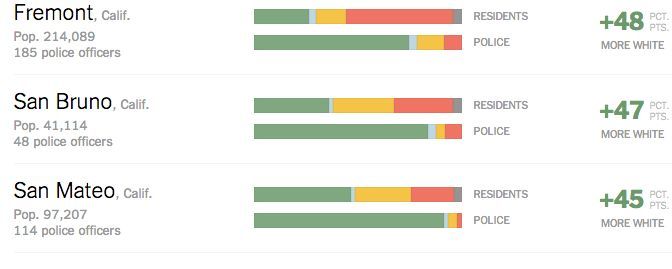
Green is white, grey is black, orange is Hispanic, red is Asian, whatever the fifth color is (silt?) is Other, and the NYT graphics department must be on PCP or at least PC
Since the Ferguson pogrom, we’ve been hearing much about both about how evil it is for whites to depart areas that are becoming increasingly nonwhite because that deprives the nonwhite newcomers of the institutional continuity and guidance of experienced whites. But it’s also evil for whites to stick around in areas that are becoming increasingly nonwhite and provide institutional continuity and guidance.
To help root out the latter form of white racism, the NYT has provided a graphical list of places where white cops just won’t die fast enough:
The Race Gap in America’s Police Departments
By JEREMY ASHKENAS and HAEYOUN PARK SEPT. 4, 2014
In hundreds of police departments across the country, the percentage of whites on the force is more than 30 percentage points higher than in the communities they serve, according to an analysis of a government survey of police departments. Minorities make up a quarter of police forces, according to the 2007 survey, the most recent comprehensive data available. Experts say that diversity in the police force increases a department’s credibility with its community. “Even if police officers of whatever race enforce the law in relatively the same way, there is a huge image problem with a department that is so out of sync with the racial composition of the local population,” said Ronald Weitzer, a sociologist at George Washington University. Listed below are local police departments from 15 metropolitan areas, sorted so that departments with the largest percentage-point differences of white officers to white residents are at the top.
Above, I’ve posted a screen shot of some of the municipalities where, apparently, the White Boot of Racial Oppression is most burdensome, such as in Fremont, CA. From the Wikipedia article on Fremont:
According to a 2007 estimate, the median income for a household in the city is $93,342, and the median income for a family was $103,846. … The racial makeup of Fremont was: 108,332 (50.6%) Asian (consisting of 18.1% Indian, 17.8% Chinese, 6.7% Filipino, 2.5% Vietnamese, 1.8% Korean, 1.0% Pakistani, 0.8% Japanese, 0.6% Burmese, 70,320 (32.8%) White (the town is home to the largest population of Afghan Americans in the United States). Non-Hispanic Whites were 26.5% of the population in 2010,[39] down from 85.4% in 1970.[40])
And about a fifth of the whites in Fremont are Afghans.
Fremont, like most municipalities on the New York Times’ List of Shame, has achieved its opprobrium by being highly attractive to nonwhites, a conundrum that doesn’t seem to occur to the NYT.
As I noted earlier, political scientist Jonathan Roddon has pointed out that the white dominance of the city council in now majority black Ferguson is rather than being a symptom of some national malaise, is instead an anomaly. African-Americans, on the whole, are quite good at electing each other city councilman. Being a cop, however, often comes with standards of intelligence and honesty that don’t apply to city councilmen (consider the career of, say, Marion Barry), plus civil servant protections against being fired simply for being the wrong race, so ethnic cleansing is often slower in police departments than in city councils.