Yesterday in “The Minneapolis Effect,” while citing City Crime Stats day-by-day data on homicides in a couple of dozen major American cities, I lamented that the University of Pennsylvania researchers hadn’t provided an aggregate graph summarizing all their cities, which could help distinguish between the validity of the crystallizing conventional wisdom that, well, yeah, there was a murder surge in 2020, but it was just bad luck due to Covid, and nobody should even think that it might have anything to do with the George Floyd Racial Reckoning versus my view: of course BLM and the media and the politicians who encouraged the hundreds of Mostly Peaceful Riots are largely to blame.
In response, an old friend, the one who provided the data for my December Takimag column on excess deaths in the US during the pandemic, scraped the data for me from the City Crime Stats site.
![]()
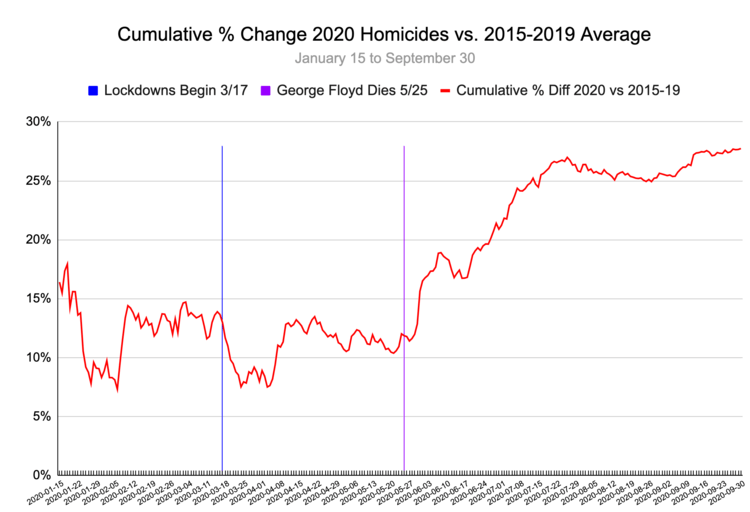
The above graph shows pretty clearly the homicide trends over the course of 2020 vs. the average for the five previous years 2015–2019 across 21 cities for which CCS had day-by-day homicide stats through the end of September 2020. I created running totals for 2020 versus the average for 2015–2019. The red line represents the percentage change from the cumulative 2015–19 average to the cumulative 2020 total.
Because the percentage difference during the earliest days of January bounces around wildly due to a small sample size, I didn’t start the graph until January 15, at which point the cumulative number of homicides in 2020 was 16% above the 2015–19 average.
The last few months of winter proved fairly violent, with the cumulative homicides so far in 2020 being 14% higher on March 16 than for the preceding five year average up through that data.
Why homicides were up in the winter of 2020 before the pandemic is hard to say. It could be a fluke—the winter sample size is small compared to the rest of the year. And, I suspect, that winter murder counts might tend to bounce up and down erratically depending upon how mild or harsh the weather is.
But, the day by day data shows that there was little direct cause-and-effect connection between the pandemic panic and 2020’s increase in murders.
San Francisco declared a lockdown on March 17 (blue vertical line on the graph), and much of the rest of urban America did too over the next couple of weeks.
Oddly, after an initial decline in murders, not much changed over the first ten weeks of pandemic panic. By Memorial Day, May 25, 2020’s cumulative homicides were running 12% ahead of 2015–19, down very slightly from the 14% before the first lockdown in mid-March.
This is not to say that the pandemic didn’t have long term effects on the murder rate. Perhaps lockdowns made people stir-crazy? Perhaps face masks contributed to the return of carjacking? Releases of prisoners due to fear of prison Covid epidemics? One theory among the NYPD is that the aversion to the subways meant that bad people couldn’t get away from their bad neighborhoods when their bad neighbors started to get on their nerves. Domestic violence was expected to skyrocket, and that may have happened in Phoenix, but my impression is that it didn’t really happen as predicted most places.
It’s easy to come up with a lot of theories about the effect of coronavirus on murder, but the weird thing is that you can’t see them having much tangible effect through Memorial Day.
Memorial Day, of course, saw the fentanyl-assisted death of George Floyd (purple vertical line). By the time of the riots of the following weekend, the Great Murder Surge of 2020 was underway. Within just 7 days after George Floyd’s death, 2020’s cumulative increase over the 5 year average jumped from 12% to 17%.
Before the beginning of the Mostly Peaceful Riots, the worst singled day in 2020 for total murders across all 21 cities was April 7 with 27. But Sunday, May 31 doubled that total with 55.
Then the change in cumulative murders plateaued at this new high level through mid-June.
But then a second national surge began about six days after the death of Rayshard Brooks in Atlanta on June 12 after he stole a cop’s tazer and shot it at him.
By the Fourth of July, murders were up 23%, and by July 21, they were up 27%.
Then murders plateaued again until a third surge began around Labor Day.
For these 21 cities for which CCS has day by day data through the end of September, they ended the third quarter cumulatively up 28%.
Nationally, the largest ever one-year increase in homicides was murderous 1968, when Martin Luther King’s assassination set off riots, at 12.7% followed by 2015 during the First BLM Era, when murders went up 12.1%. So, 2020 was the worst year for increase in homicides over the 60 years for which we have reliable data.
[Comment at Unz.com]