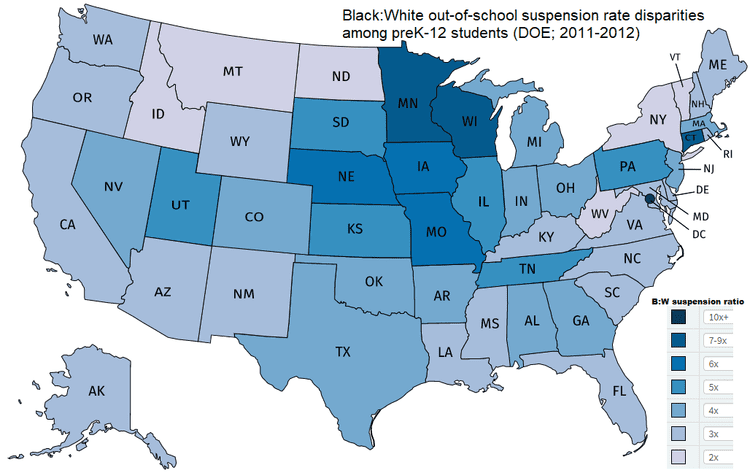
The following map and table were constructed using data collected during the 2011-2012 school year, covering American PreK-12 students during that time. They show the ratio of black students to white students given out-of-school suspension at least once during the course of the year, by state (except for Hawaii):

| State | B:W |
| District of Columbia | 12x |
| Wisconsin | 9x |
| Connecticut | 8x |
| Minnesota | 7x |
| Nebraska | 6x |
| Missouri | 6x |
| Iowa | 6x |
| Pennsylvania | 5x |
| Illinois | 5x |
| South Dakota | 5x |
| Utah | 5x |
| Kansas | 5x |
| Tennessee | 5x |
| Indiana | 4x |
| Texas | 4x |
| Michigan | 4x |
| New Jersey | 4x |
| Ohio | 4x |
| Oklahoma | 4x |
| Georgia | 4x |
| Arkansas | 4x |
| Colorado | 4x |
| Massachusetts | 4x |
| Alabama | 4x |
| Nevada | 4x |
| North Carolina | 3x |
| Wyoming | 3x |
| California | 3x |
| New Hampshire | 3x |
| Oregon | 3x |
| Delaware | 3x |
| Mississippi | 3x |
| Virginia | 3x |
| Alaska | 3x |
| Kentucky | 3x |
| Rhode Island | 3x |
| Arizona | 3x |
| South Carolina | 3x |
| Florida | 3x |
| Louisiana | 3x |
| New Mexico | 3x |
| Washington | 3x |
| Maryland | 3x |
| Maine | 3x |
| West Virginia | 2x |
| Montana | 2x |
| Idaho | 2x |
| New York | 2x |
| Vermont | 2x |
| North Dakota | 2x |
Though the results come from a pool covering 49 million students, the DOE report rounds rates to the nearest full percentage. I’ve consequently done the same with displayed ratios. The states are however still ranked in the table by non-rounded ratios.
It’s worth noting that these school suspension disparities are considerably narrower than are the disparities in violent crime among black and white adults.
A few other interesting gleaned insights: