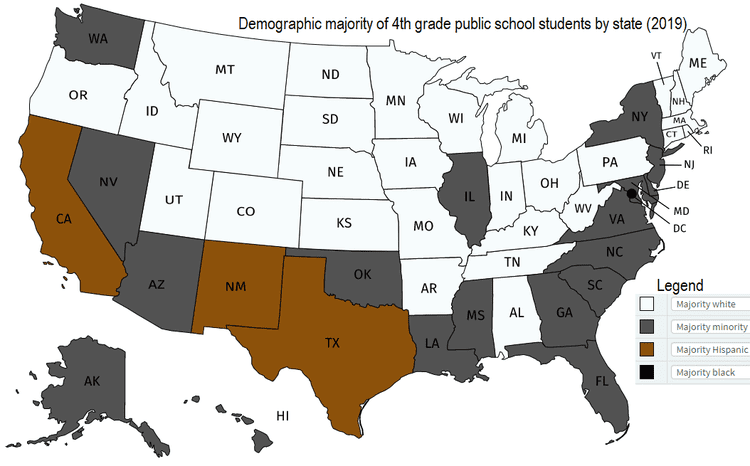
The map below depicts demographic majorities of 4th grade public school students by state:

Most states remain majority-white, but the four most populous states do not. Consequently, the nationwide elementary public school population is now majority-minority. Assuming current demographic trends continue, the country will likewise have become majority-minority by the time these students reach middle-aged adulthood.
The following table lists states by the percentage of the 4th grade public school student population that is non-Hispanic white:
| State | %white |
| 1) Vermont | 90 |
| 2) West Virginia | 89 |
| 3) Maine | 88 |
| 4) New Hampshire | 85 |
| 5) Montana | 79 |
| 6) Wyoming | 78 |
| 7) North Dakota | 77 |
| 8) Idaho | 75 |
| 8) Kentucky | 75 |
| 10) Iowa | 74 |
| 10) Utah | 74 |
| 12) South Dakota | 73 |
| 13) Ohio | 69 |
| 14) Missouri | 68 |
| 15) Wisconsin | 67 |
| 16) Indiana | 65 |
| 16) Michigan | 65 |
| 16) Nebraska | 65 |
| 19) Kansas | 63 |
| 19) Minnesota | 63 |
| 19) Pennsylvania | 63 |
| 22) Oregon | 62 |
| 23) Tennessee | 61 |
| 24) Arkansas | 60 |
| 25) Massachusetts | 57 |
| 26) Rhode Island | 56 |
| 27) Alabama | 53 |
| 27) Colorado | 53 |
| 29) Connecticut | 52 |
| 30) Washington | 50 |
| 31) South Carolina | 49 |
| 31) Virginia | 49 |
| 33) Illinois | 46 |
| 33) North Carolina | 46 |
| 33) Oklahoma | 46 |
| 36) Alaska | 45 |
| 37) Louisiana | 44 |
| 37) Mississippi | 44 |
| 39) New York | 43 |
| 40) Delaware | 42 |
| 40) New Jersey | 42 |
| 42) Arizona | 41 |
| 43) Florida | 39 |
| 44) Georgia | 36 |
| 45) Maryland | 33 |
| 46) Nevada | 31 |
| 47) Texas | 27 |
| 48) New Mexico | 24 |
| 49) California | 21 |
| 50) Hawaii | 13 |
| 50) Washington DC | 13 |
Though the Great Replacement is a conspiracy theory only those wishing to be hurled into the void dare discuss, it is hard not to notice that in all of the once reliably red states now in the process of becoming blue–Texas, Georgia, Florida, Arizona, North Carolina–the next generation is majority non-white. It’s almost as though Democrats cannot lose in states where most of the population is not white.