[Research by Edwin S. Rubenstein]
For various reasons (think: conference) we’re late with our analysis of the March jobs data, received triumphantly by the Regime Media [Strong Job Gains in March Keep a Flame Under the Recovery, by Talmon Joseph Smith, NYT, April 3, 2022]. But that does us allow us to place it in the context of the subsequently reported increase in border apprehensions to a multiyear high, the subsequently reported increase in inflation, also to a multiyear high, and the subsequently reported completely unexpected GDP contraction in 2022’s first quarter [White House plays down first-quarter growth decline, by Jeanna Smialek and Madeleine Ngo, NYT, April 28, 2022]. And the truth is that, factoring in immigration, which no one except VDARE.com ever seems to do, March job growth was not all that great for Americans—because it was exceeded by the increase in the immigrant (legal and illegal, federal data does not distinguish) labor force.
The economy added back 431,000 jobs in March, according to the Payroll Survey, as the unemployment rate dropped by a more-than-expected two-tenths of one percent, to 3.6%. The country is now just one percentage point above the historic low (3.5%) seen in February 2020 at the peak of the Trump boom. Equally important, the Labor Force Participation rate remains one percentage point below its pre-pandemic level.
Our analysis of the March Household Survey indicates an employment gain of 736,000—about 300,000, or 41% more jobs than the figure reported in the Payroll Survey.
As far as total employment is concerned, Household Survey figures are invariably above Payroll Figures. The employment “gap” between the two in February was 7.3 million, or 4.6%, in favor of the Household Survey. In March, the gap expanded to 7.6 million, or 4.8%. One likely explanation: U.S. businesses are reluctant to acknowledge illegals working “off the books.” This illicit workforce is counted in the Household Employment Survey, but not on the Payroll Employment Survey.
Job growth by nativity, calculated exclusively by VDARE.com from data in the Household Employment Survey, in March was as follows:
The New VDARE American Worker Displacement Index (NVDAWDI), our name for the ratio of the immigrant to native-born employment growth indexes since Jan. 2009, fell from 121.7 in February to 120.8 in March, a 0.7% decline.
Despite the 986,000 immigrants reported as unemployed in March, the foreign-born working-age population expanded by some 1.4 million, Y-O-Y, for the seventh straight month. Thus the growth in the immigrant workforce population far exceeded the job growth recorded by either the Payroll Survey (431,000) or the Household Survey (736,000).
Note carefully what this chart shows. Unlike our other charts, which show absolute values, this one compares each month to the same month of the prior year. So the immigrant workforce population grew by 1.397 million in March compared to March 2021. The corresponding increases for January and February were 1.538 million and 1.345 million, respectively.
For most of 2020, President Trump’s last year in office, the population of working-age immigrants declined Y-O-Y. This far exceeded the net exodus during the 2008 Great Recession, and the brief net exodus during Trump’s first year, when his mere presence seemed to have jawboned illegals into fleeing.
The immigrant population of working age did not resume growth until December 2020—when the election results spurred a renewed invasion.
Another displacement metric—the immigrant share of total employment—fell last month, but remains close to the record touched in April 2018. Our analysis indicates that 17.819% of jobs were held by immigrants in March.
Note that, after some gyrations, the immigrant share of employment had been falling steadily even before the pandemic started. But, again, the Trump gains have been wiped out and the immigrant share will resume its Obama Era upward march—unless the political climate changes again.
In March 158.5 million people held jobs in the U.S. Each 1% rise in immigrant employment share represents a transfer of about 1.58 million jobs from native-born Americans to immigrants.
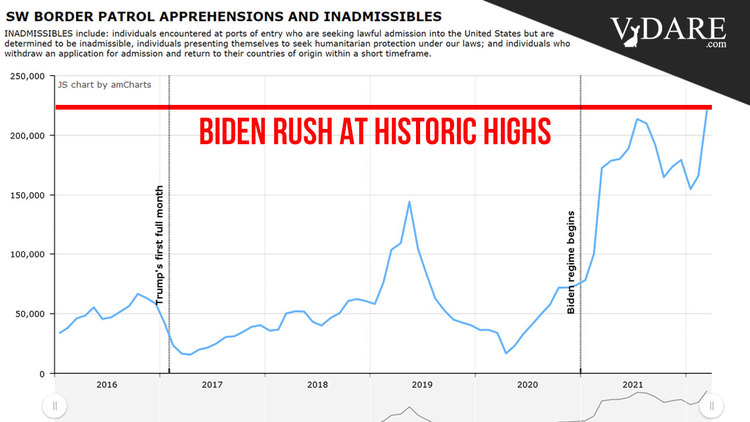
Additionally, of course the Biden Rush over the southern border continues:
It will take some time before this feeds through into American Worker Displacement—to say nothing of American Voter Displacement—but it will.
We are told incessantly that the labor market is strong, that the demand for labor is far greater than the supply. If true, employers should be raising wages to lure workers back to work. But it’s not happening. Average hourly earnings rose 5.6%, Y-O-Y, in March, slightly below expectations, but well below inflation

Source: Inflation Hits Fastest Pace Since 1981, at 8.5% Through March, by Jeanna Smialek, New York Times, April 12, 2022.
Bottom line: Price hikes have turned nominal wage gains into real (inflation adjusted) wage losses.
A more detailed picture of how native-born American workers have fared vis-à-vis immigrants is published in Table A-7 of the monthly BLS Report:
|
Employment Status by Nativity, Mar.2021-Mar. 2022 |
||||
|
(numbers in 1000s; not seasonally adjusted) |
||||
|
|
Mar-21 |
Mar-22 |
Change |
% Change |
|
|
Foreign born, 16 years and older |
|||
|
Civilian population |
43,059 |
44,456 |
1,397 |
3.24% |
|
Civilian labor force |
27,775 |
29,159 |
1,384 |
4.98% |
|
Participation rate (%) |
64.5 |
65.6 |
1.1%pts. |
1.71% |
|
Employed |
25,886 |
28,172 |
2,286 |
8.83% |
|
Employment/population (%) |
60.1 |
63.4 |
3.3%pts. |
5.49% |
|
Unemployed |
1,889 |
986 |
-903 |
-47.80% |
|
Unemployment rate (%) |
6.8 |
3.4 |
-3.4pts. |
-50.00% |
|
Not in labor force |
15,285 |
15,297 |
12 |
0.08% |
|
|
Native born, 16 years and older |
|||
|
Civilian population |
217,944 |
218,988 |
1,044 |
0.48% |
|
Civilian labor force |
132,623 |
135,115 |
2,492 |
1.88% |
|
Participation rate (%) |
60.9 |
61.7 |
0.8%pts. |
1.31% |
|
Employed |
124,607 |
129,933 |
5,326 |
4.27% |
|
Employment/population (%) |
57.2 |
59.3 |
2.1%pts. |
3.67% |
|
Unemployed |
8,016 |
5,182 |
-2,834 |
-35.35% |
|
Unemployment rate (%) |
6.0 |
3.8 |
-2.2pts. |
-36.67% |
|
Not in labor force |
85,321 |
83,873 |
-1,448 |
-1.70% |
|
Source: BLS, The Employment Situation, March 2022. Table A-7, April 1, 2022. |
||||
From March 2021 to March 2022:
The big picture: The U.S. economy still has roughly 1.6 million fewer jobs than before the mass layoffs that began in February 2020.
And that’s before the possible recession that even the Regime Media is beginning to fear [The U.S. economy shrank last quarter. Is a recession next?, by Aimee Picchi, CBS, May 3, 2022].
Americans are increasingly worried about the economy, with about 6 in 10 concerned that a major recession is "right around the corner," according to a recent survey https://t.co/eZoPFLNIi4
— CBS Evening News (@CBSEveningNews) May 3, 2022
Peter Brimelow [Email him] is the editor of VDARE.com. His best-selling book, Alien Nation: Common Sense About America’s Immigration Disaster, is now available in Kindle format.